
Cost-effectiveness study of diagnosis strategies of acute viral infections in Ukraine
-
Copyright
© 2016 PRO MEDICINA Foundation, Published by PRO MEDICINA Foundation
User License
The journal provides published content under the terms of the Creative Commons 4.0 Attribution-International Non-Commercial Use (CC BY-NC 4.0) license.
Authors
| Name | Affiliation | |
|---|---|---|
Sergii Soloviov |
Department of Virology, Shupyk National medical academy of postgraduate education, Kyiv, Ukraine |
|
Iryna Dzyublyk |
Department of Virology, Shupyk National medical academy of postgraduate education, Kyiv, Ukraine |
|
Olha Zaliska |
Danylo Halytsky Lviv National Medical University, Lviv, Ukraine
|
|
Oresta Piniazhko |
Danylo Halytsky Lviv National Medical University, Lviv , Ukraine |
|
Svitlana Dediuk |
Department of Applied Mathematics, the National Technical University of Ukraine “Kyiv Polytechnic Institute”, Kyiv, Ukraine, |
Background: Efficient and accurate laboratory diagnosis of viral pathogens is of primary importance for clinical care in terms of health care system reforms. The methodological approach of cost-effectiveness analysis of laboratory diagnosis tests for viral infections from payer’s perspective was presented. We argue on an expository software-based technique for assessing the costs of newer laboratory tests.
Methods: We applied decision tree modeling techniques to compare expected costs and effectiveness of strategies for the diagnosis of viral infections. We conducted univariate and Monte-Carlo method based multivariate sensitivity analysis.
Results: Operating characteristics of diagnostic methods have been described. The analytical modeling, based on the cost-effectiveness method for the detection of human viruses were conducted. We considered three strategies: the use of only rapid tests for detection of one pathogen – adenoviruses; multiplexed PCR for 12 viruses, including adenoviruses; and combined strategy with confirmation of negative result of rapid test via use of PCR method. Univariative analysis showed that the cost savings achieved by use of PCR were 45% less per unit of effectiveness than the cost per effectiveness unit of rapid tests. Moreover multivariate probabilistic analysis, taking into account uncertainty of all operating characteristics, showed similar results for PCR method.
Conclusions: Acceptability and usability of the applied cost-effectiveness methodology was outlined and provided in computer application for the analysis of diagnosis strategies of acute viral infections. Feasibility of study results implementation by managers was discussed to improve laboratory services and to support patient management and disease control in Ukraine.
Introduction
Efficient and accurate laboratory diagnosis of viral pathogens is of primary importance for clinical care in the Ukrainian settings in terms of health care system reforms. The significance of economic consequences and costs of laboratory diagnosis and diagnostic tests is needed to be assessed. Current trends towards convergence of medical facilities to the patient, i.e. the presence of ambulatory health-care institutions in geographically most remote areas, the need for medical care, including blood transfusions, urgent intervention in case of critical conditions (trauma, environmental disasters and other emergencies) require the development and use of sensitive and specific methods of laboratory diagnosis of infectious diseases. The priority infectious diseases in Ukraine are: HIV/ AIDS, viral hepatitis B and C, influenza and other acute respiratory and intestinal infections [1-7]. Due to the research results of different authors of viral agents’ role in the structure of infectious morbidity and mortality vary considerably not only in case of multinational studies in countries with different political and economic situation, but also within the same country. Typically such variability is closely linked to many factors, such as use of different methods of laboratory diagnosis, diagnostic test kits, inappropriate reagents and apparatus, inappropriate terms and conditions of selection, storage and transport of clinical material to a specialized laboratory [2].
In Ukraine laboratory diagnosis of viral diseases includes classic methods of viral agent isolation in appropriate biological systems for its identification and titration of specific antibodies from patients with the use of different serologic reactions (neutralization, hemagglutination inhibition, complement fixation, immunodiffusion, precipitation etc.). Usually, these methods are prolonged in time lasting from 3-5 days to 2-3 weeks. Meanwhile infectiology requires certainty regarding the etiology of an infectious disease. Rapid diagnosis of infectious diseases allows pathogen or antigen detection directly in clinical material for several hours during working day and are successfully used in laboratory practice today. Among them – the fluorescent antibodies method (IFA), indirect hemagglutination assay, latex agglutination test (LAT), enzyme-linked immunosorbent assay (ELISA), radioimmunoassay analysis (RIA) and others. The use of emerging technologies such as molecular-genetic method (PCR) or rapid methods (simple/rapid tests) at the earlier stage will improve the etiological diagnosis of viral diseases [1-2].
Among the priority issues for laboratories of virological profile in Ukraine are the following: quality and effectiveness of laboratory diagnosis and minimization of costs for laboratory research. Cost-effectiveness method allows to calculate cost-effectiveness ratio and incremental cost-effectiveness ratio of each diagnostic technology. Improvement of the quality of laboratory diagnostics and cost cutting for additional diagnostic procedures deemed appropriate use of cost-effectiveness studies in choice of not only a method of etiologic diagnosis, but also a comprehensive diagnosis strategy for the most relevant pathogens of viral infections due to the dynamics of infection and the nature of the disease process: acute or chronic. Acute viral infections, e.g. influenza, begin suddenly and are characterized by short average duration of illness [1,5,7]. That is why the diagnosis of acute viral infections requires rapid determination of the pathogen via the use of various diagnostic strategies – combinations of different technologies for pathogen detection, whether serological methods, PCR or rapid tests [2].
Implementation of cost-effectiveness methodology, applied to laboratory medicine requires primarily determination and definition of key characteristics to be used: prevalence and incidence of disease, sensitivity and specificity of the diagnostic test, total cost of diagnosis strategy and its expected effectiveness. This article presents a methodological approach for evaluation of laboratory testing strategies of viral infections and an expository software-based technique for assessing the costs of newer laboratory tests with the use of the above-mentioned parameters. In this article we used basic terminology:
Etiological diagnosis technology (or method) - a set of actions aimed to identify the etiological agent of infectious disease with the use of certain approaches and chemical reagents.
Algorithm of etiological diagnosis - a sequence of physician’s or laboratory technician’s actions for determination of etiologic agent with the use of certain diagnostic technology.
Diagnostic strategy - a set of activities, aimed to use available human and financial resources efficiently for determination of etiologic agent of infectious disease with the use of certain diagnostic algorithms.
Methods
Operating characteristics of diagnostic tests
Operating characteristics are used to characterize informative diagnostic research methods [8]. The most important operating characteristics of each diagnostic technology are:
- diagnostic spectrum (p),
- sensitivity (Se),
- specificity (Sp).
Auxiliary operating characteristics are:
- accuracy (Ac),
- positive predictive value (PPV),
- negative predictive value (NPV).
A simple tool for determination of the aforecited characteristics is contingency table 2 × 2, including different diagnostic results, positive or negative, according to possible health status of the patient: presence or absence of infectious disease (Tab. 1).
Table 1. Contingency table 2 × 2
| Test result | Infectious disease | Sum | |
| present | absent | ||
| Positive | a | b | a+b |
| Negative | c | d | c+d |
| Sum | a+c | b+d | n= a+d+c+d |
a - number of positive results
b - number of false positive results
c - number of false negative results
d – number of negative results
a/n - detection rate
(a+b)/n - share of positive diagnostic results
(a+c)/n - diagnostic spectrum (p)
a/(a+c) - diagnostic test sensitivity (Se)
d/(b+d) - diagnostic test specificity (Sp)
a+d/n - diagnostic accuracy (Ac)
a/(a+b) - positive predictive value (PPV)
d/(c+d) - negative predictive value (NPV).
Diagnostic spectrum
Diagnostic spectrum is the frequency or probability of detection of pathogens - targets for certain diagnostic test across the completely etiologic spectrum of viruses detected in tested patients with the same clinical symptoms. Thus, a certain spectrum of diagnostic test or test systems for a particular period may be determined as prevalence of the disease and defined as:
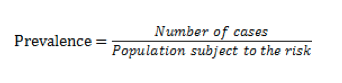
Prevalence is cumulative characteristic that shows the number of disease cases per 1 or 100 thousand people over a certain period of time, for example, month. Incidence is flow characteristic and defined the number of disease cases per 1 or 100 thousand people in every unit of time, for example, day. Ratio of prevalence and incidence determines average duration of illness subject to other variables held constant:
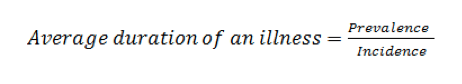
It can be illustrated as the volume of liquid in the tank (prevalence) and the liquid flow rate per unit time (incidence). So the average duration of an illness can be explained as average residence time of molecules of the liquid in the tank (Fig. 1) [9].
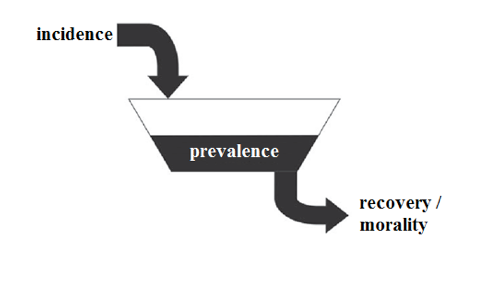
Figure 1. Schematic representation of prevalence and incidence
Acute viral diseases such as influenza have short average duration of illness, so its incidence rate is much higher than the prevalence, defined in the same period.
Prevalence of disease is also a priori probability of the disease, which is determined by historical data, personal experience, and official statistical data or from literature that is more general.
Sometimes authors in the medical literature also use the term risk and it indicates the likelihood of the disease, but it is an unfortunate use of the term as the general use of risk associated with economic uncertainty, which correlates with the likelihood of possible outcomes.
Sensitivity, specificity and accuracy
Sensitivity of diagnostic test is its ability to detect the maximum number of true positive samples, and specificity – its ability to detect only target pathogen, that characterizes minimum number of false positive results. In other words, the sensitivity of the test – is probability of true positive result across all positive results and specificity – probability of true negative result across all negative ones. Thus sensitivity characterizes discriminatory power of test towards detection of infected persons, and specificity –healthy ones. Probability of health state, determined with certain test is called prognostic value of the test. We distinguish between positive and negative forms of predictive values.
Accuracy (Ac) – is the proportion of correct test results (i.e., the sum of true positive and true negative results) of all studied patients.
Thus accuracy shows how many correct results can be obtained with application of this method of research. Sometimes this criterion is also called the index of the diagnostic efficiency, diagnostic efficiency.
The accuracy of diagnostic method depends on:
- method itself,
- used equipment,
- selected criteria of pathology,
- target population.
Previously, “quality” or accuracy of diagnostic tests was evaluated by comparing results of testing of obviously sick patients and healthy volunteers. So naturally results expressed significant differences between groups. For actual practice the results of such studies are often little applicable as a hidden disease cases give occasional “likelihood” presence of disease, and the purpose of diagnostic studies is often recognition of implicit symptoms.
Moreover from a practical point of view probability of matching test results with final diagnosis is of interest to assess the results of research. For these purposes performance predictability can be estimated.
Thus criteria of posteriori probability – predictabilities of positive and negative results are important for a proper understanding effectiveness of diagnostic methods. These criteria indicate probability of disease (or its absence) with known results of the study. It is easy to understand that the posterior indicators are more important than a priori ones.
Predictive value and predictability
Test predictive value - probability of disease presence, subject to known results of diagnostic study, and calculated on the basis of sensitivity and specificity values.
Positive predictive value, PPV - is a probability of disease presence subject to positive result of diagnostic test, proportion of true positive results among all test positive results.
Negative predictive value, NPV – is a probability of disease absence subject to negative (normal) results of diagnostic test, proportion of true negative results among all test negative results.
Prognostic value is a characteristic of not only a method, but it depends on its sensitivity and specificity, prevalence of disease in population to be tested, ie the proportion of people with studied disease in a particular population at a given time period. Prevalence - priori or pretest probability, ie the probability of disease detection before the results of diagnostic study have become known.
The more sensitive test is, the higher the negative predictive value (ie increasing physician confidence in the fact that the negative results of the study rejected the presence of disease) is. Conversely, the more specific test is, the better predictive value of positive result (ie doctor can more safely assume that the positive results confirm the alleged diagnosis) is. As the prevalence of the disease affects the predictive value of diagnostic method, the latter inevitably depends on the conditions of its implementation. If positive results of even highly specific diagnostic method are obtained in populations with a low probability of disease, its great proportion will be false positive.
Expected utility or effectiveness of diagnostic tests
In laboratory medicine one unit of utility or effectiveness of diagnostic technology is determined as excellent pathogen detection or confirmation of its absence – true positive or negative diagnosis result. The expected result of basic utility function according to the rule of John von Neumann and Oskar Morgenstern by multiplying probabilities of diagnostic outcomes on utilities of these outcomes and then summing these products [10]:

Thus, formula (3) is general, citing the work of von Neumann and Oskar Morgenstern, and represents the expected utility EU(y) as the sum of the products of elementary utilities U of y diagnostic consequences H, multiplied by their respective probabilities [10,11].
Methodology of cost-effectiveness analysis for laboratory diagnostic tests
We propose to use cost-effectiveness (CE) method in combination with the methods of mathematical modeling – an approach based on building probabilistic mathematical model - a decision tree, a tool for the selection of optimal version in the presence of incomplete or insufficiently reliable clinical and laboratory information. The branches of decision tree represent a strategic choice alternative (diagnostic scheme) with a probability of occurrence of events and the final result (the cost of each technology and its diagnostic effectiveness) [12-14].
Our method of analysis is based on existing or developed algorithms of diagnosis of viral infections, which can analyze diagnostic strategies with different approaches [15-16]. In this case it can be considered to use only one diagnostic strategy (strategy (i)). Such analytical model or decision tree represents specific etiological diagnosis strategies and has branches, reflecting the diagnostic status of patients (true positive, false-positive, false-negative and true negative). In case of false-positive or false-negative diagnostic status of the patient diagnostic efficiency strategy is equal to zero. In case of use of pair of diagnostic methods, there are five options for comparing the diagnostic spectrum Pi and Pj when selecting a combined strategy (i + j) (Fig. 2).
 Figure 2. Options for comparison of diagnostic spectrum when combining diagnostic methods (i, j)
Use of combined strategy of (i + j) is necessary in case of verification of negative results with the use of diagnostic technology (j), since a negative result of its use does not preclude a possible infection because of probable insufficient sensitivity of diagnostic technology (i) (Supplemental Figures 2-6).
Appropriate analytical model will allow to make necessary calculations of expected cost and effectiveness as well as CER and ΔCER values. For example, for the strategy (i) (Supplemental Figure 1) such calculation of expected costs and effectiveness is based on a formula (4).
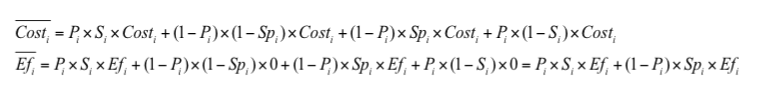
Calculation of CER and ΔCER is based on a formulas (1-2) with the use of expected cost and effectiveness values (6).
Algorithm of calculation for other decision trees (Supplemental Figures 2-6) is similar.
Results
Software
We have developed C++-based software “Pharmacoeconomic analysis of diagnostic strategies of respiratory viral infections” as application, based on proposed CE methodology for evaluation of strategies for diagnosis of community-acquired respiratory viral infections in health care units. Application provides univariate or multivariate sensitivity analysis and indicates a high specificity, requiring attentiveness of physician or head of a specialized laboratory department. Application can be found in Supplemental Materials (Analysis.exe).
Case study of CE methodology use
Usability of developed CE methodology can be showed as application for the analysis of diagnosis strategies of acute viral infections, where probable etiological agents are respiratory viruses. During our laboratory research we have been studying clinical specimens (nasopharyngeal washings and sputum) from 114 patients in the age group of 18-60 years with community acquired pneumonia (CAP). The study group characteristics before viral investigation are presented in Table 2.
Table 2. The study group characteristics
| Characteristics | % | Study group | |
| Age | 18-30 | 78,07 | 89 |
| 31-60 | 13,15 | 15 | |
| >60 | 8,78 | 10 | |
| Comorbidities | yes | 0,87 | 1 |
| no | 99,13 | 113 | |
| Number of hospitalization days | {7-14} | 18,42 | 21 |
| {15-21} | 68,42 | 78 | |
| {22-32} | 13,16 | 15 | |
Bacterial agent |
Not found | 0,88 | 1 |
| St. aureus | 12,28 | 14 | |
| St. aureus+Candida albicans | 0,88 | 1 | |
| Str. Viridans | 21,05 | 24 | |
| Str. pneumoniae | 31,58 | 36 | |
| St. Saprophiticus | 25,44 | 29 | |
| St. pyogenes | 7,01 | 8 | |
| St. pyogenes+Candida albicans | 0,88 | 1 | |
Rapid tests and molecular genetic technologies based on PCR method were used for the detection and identification of respiratory viruses. Results are presented in Fig. 3.
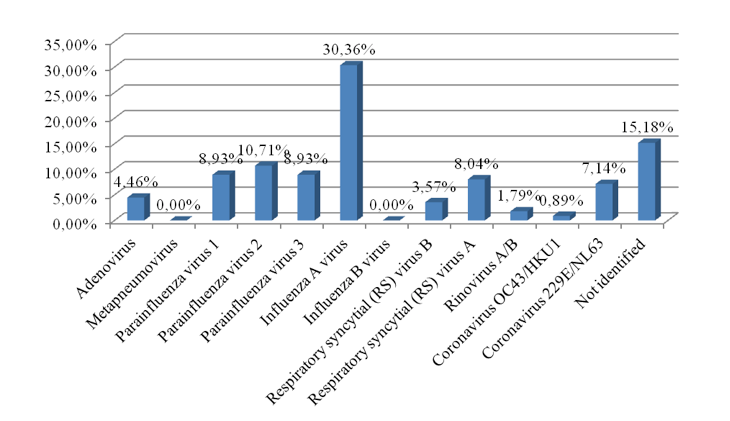
Figure 3. The spectrum of respiratory viruses among patients with CAP in Ukraine
Considering that in Ukraine rapid tests for detection of influenza virus A + B, adenoviruses and respiratory PC viruses are widely used, as example we proposed to investigate laboratory strategies for detection of respiratory adenoviruses. We considered three strategies of choice: the use of only rapid tests for detection of one pathogen – adenoviruses; multiplexed PCR for twelve respiratory viruses, including adenoviruses; and combined strategy with confirmation of negative result of rapid test via use of PCR method. Operating characteristics of both diagnostic strategies, such as sensitivity, specificity and costs have been taken from public sources and instructions to diagnostic tests, diagnostic spectrum – from our laboratory studies (Tab. 3).
Table 3. Operating characteristics of both diagnostic strategies
| Diagnosticstrategy with the use of only rapid tests | Diagnostic Strategy with the use of only PCR method |
| - Sensitivity - 85%- Specificity - 95%- Diagnostic spectrum p1 - 4.46% (adenoviruses)- Cost per one pathogen detection – 2,35 USD.- Effectiveness - 1 target pathogen (1 unit) | - Sensitivity - 85%- Specificity - 95%- Diagnostic spectrum p2 - 84.8% (adenoviruses, metapnevmovirus, viruses, parainfluenza 1, parainfluenza virus 2, parainfluenza virus 3, influenza A virus, influenza B virus, respiratory syncytial viruses A, respiratory syncytial virus B, rhinoviruses A / B, coronavirus OC43 / HKU1, coronavirus 229E / NL63)- Cost per twelve pathogens detection- 15,7 USD(Cost per one pathogen detection ~ 1,3 USD)- Effectiveness – 12 target pathogens (12 units) |
| Diagnostic spectrum p1 is a part of diagnostic spectrum p2 | |
Simulation results of univariate analysis towards diagnostic spectrum change showed that in case of high sensitivity and specificity of both tests (80%) diagnostic strategy of only multiplexed PCR method use is rather cost-effective. Its implementation will reduce the cost of one diagnostic effectiveness unit (one identified pathogen) by 45% in average, comparing with only rapid test use. The use of combined strategy will reduce the cost of one diagnostic effectiveness unit by 33% in average, comparing with only rapid test use (Fig. 4).
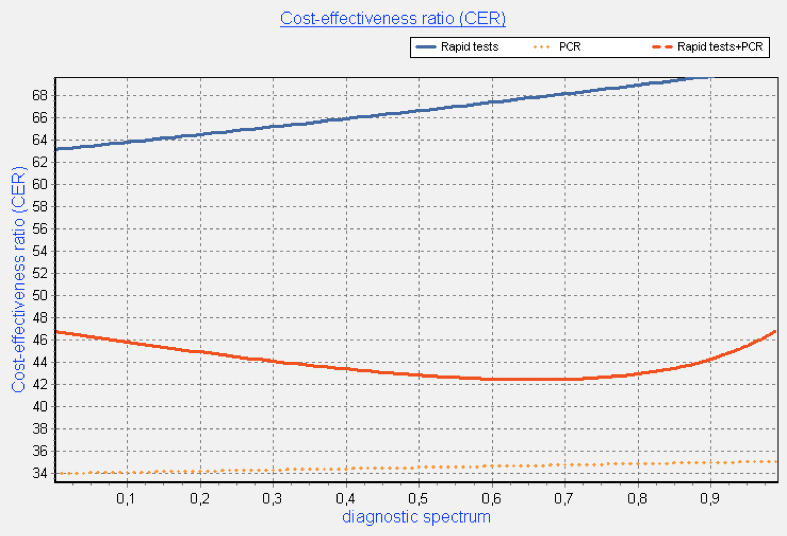
Figure 4. Analysis of dependence of CER diagnostic spectrum of pathogens
Multivariate probabilistic analysis, taking into account uncertainty of all operating characteristics and based on Monte-Carlo method, showed similar results. Implementation of diagnostic strategy of only multiplexed PCR method use will reduce the cost per unit of diagnostic effectiveness by 51.4% versus only rapid test use and the implementation of combined diagnostic strategy – by 38.8% (fig. 5-6).
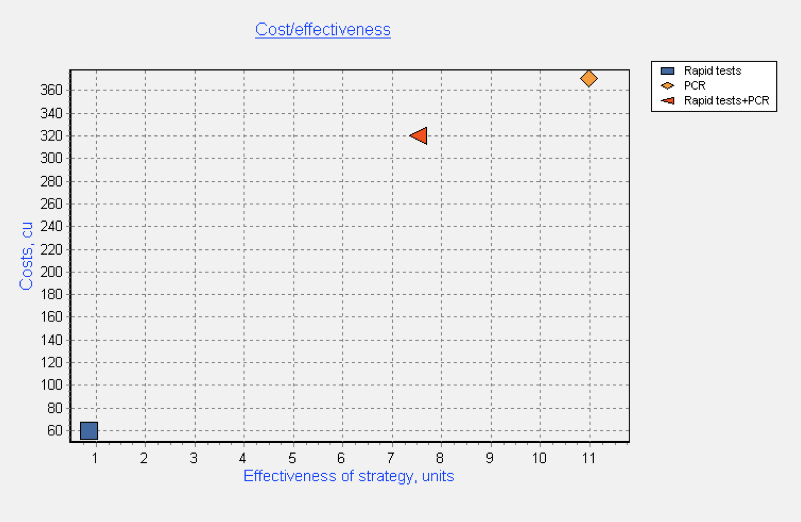
Figure 5. Costs and effectiveness of each diagnostic strategy and its combination (multivariate analysis)
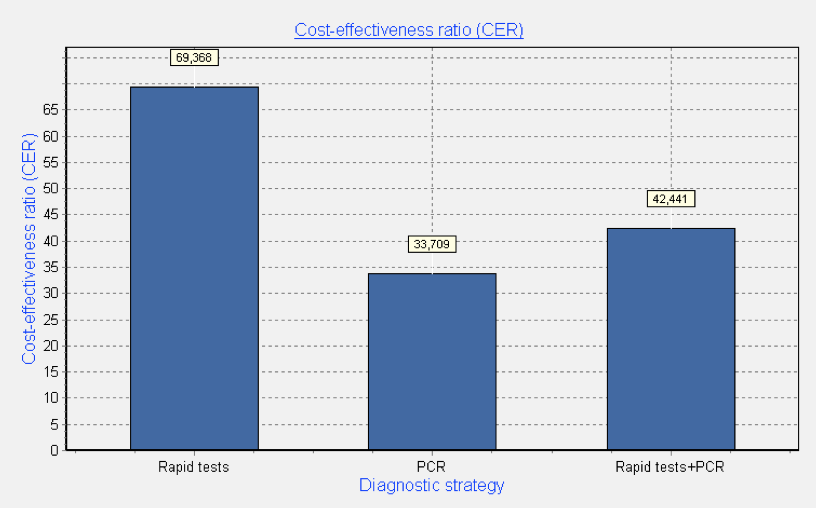
Figure 6. Expected values of CER of each diagnostic strategy (multivariate analysis)
Discussion and Conclusions
A literature review, conducted across Russian-language and English-language articles, dedicated to the similar direction of research, showed that these studies mainly reflect an assessment of diagnostic technologies in terms of subsequent medical interventions. For example, in the Russian-language paper [17], describing cost-effectiveness studies of drugs for the diagnosis of tuberculosis infection cost structure included not only costs of diagnostic but also therapeutic procedures, cost of physician’s visit and cost of active pulmonary tuberculosis chemotherapy. The effectiveness of the diagnosis of tuberculosis infection was defined as the proportion of patients with active tuberculosis. Similarly, in another Russian-language paper [18] there was conducted an economic assessment of flow cytometry method used to assess the functional activity of platelets in patients receiving antiplatelet drugs. Authors assessed the direct and indirect costs for diagnosis and treatment of patients with parallel evaluation of effectiveness of the testing approaches in percentage of patients with disease-free period during the year.
A similar trend is observed in the English-language papers [19]. For example the study of cost-effectiveness of malaria diagnostic methods in sub-Saharan Africa also takes into account both the costs of screening diagnostics and the artemisinin-based combination therapy [20]. The most close to our research is the study of J. B. Mahony et al., in which the authors analyzed the costs of multiplex PCR testing for diagnosing respiratory virus infections [21]. In this study as well as in our proposed approach, cost analysis study was also performed using decision tree modeling. The decision tree model was constructed by using four testing strategies for respiratory virus detection, viz., direct fluorescent-antibody staining (DFA) alone, DFA plus shell vial culture (SVC), the xTAG RVP test alone, or DFA plus the xTAG RVP test. At the same time this study has two significant differences from our one. It compared only the weighted costs of using each diagnostic technology without introducing the concept of effectiveness and applied only to the diagnosis of respiratory viruses.
In our paper we proposed general cost-effectiveness approach for evaluation of diagnosis strategies of any acute viral infections from the point of view of laboratory assistant and physician - head of the diagnostic laboratory. Operating characteristics of diagnostic methods, such as sensitivity, specificity and diagnostic spectrum, costs and effectiveness, have been described. It has been shown their use in analytical modeling, based on the cost-effectiveness method for the better choice of diagnostic strategies for the detection of human viruses. We used decision tree modeling techniques to compare expected costs and effectiveness of studied strategies for the diagnosis of viral infections.
Practical use of developed cost-effectiveness methodology was showed as computer application for the analysis of diagnosis strategies of acute viral infections, which probable etiological agents are respiratory viruses. For such purpose software called “Pharmacoeconomic analysis of diagnostic strategies of respiratory viral infections” has been developed- an application, based on proposed methodology for evaluation of strategies for diagnosis of community-acquired respiratory viral infections in health care units, providing univariate and Monte-Carlo method based multivariate sensitivity analysis.
As an example we used results of our laboratory research studies of 114 patients aged 19 to 25 years with community acquired pneumonia (CAP), using rapid tests and molecular genetic technologies based on PCR method for the detection and identification of respiratory viruses. We considered three strategies of choice: the use of only rapid tests for detection of one pathogen – adenoviruses; multiplexed PCR for twelve respiratory viruses, including adenoviruses; and combined strategy with confirmation of negative result of rapid test via use of PCR method.
Our study, which compared the cost of multiplex PCR testing to the cost of rapid tests, is the first cost analysis study involving multiplex nucleic acid amplification testing for the detection of infectious diseases in Ukraine. As in a different study [21] the fact that multiplex PCR is the least costly diagnostic strategy for the detection of respiratory viruses was surprising and significant for a number of reasons. The introduction of new technology is usually associated with increased costs, as new technology is often more expensive and is deployed as an add-on test which increases costs. In our study, we demonstrated the expected cost per case investigated using these testing strategies and showed that testing by PCR method alone was the least costly approach for the diagnosis of viral respiratory tract infections. It was less costly than the testing algorithm with the use of rapid tests, a strategy which is widely used by many physicians in Ukraine. Univariative analysis showed that the cost savings achieved by use of PCR were 45% less per unit of effectiveness than the cost per effectiveness unit of rapid tests across entire diagnostic spectrum. Moreover multivariate probabilistic analysis, taking into account uncertainty of all operating characteristics, showed similar results for PCR method. Our finding that the PCR method was the least costly strategy at any infection prevalence is particularly important, as this suggests that the savings associated with its use will apply all 12 months of the year, including the months with a lower prevalence of respiratory virus infections in Ukrainian population.
Limitations
The limitations of our study consist, for the most part, in fact that we have developed analytical approach for evaluation of diagnostic strategy individually, using its operating characteristics, i.e., sensitivity and specificity, but not considering them in a common analytical decision support system including quality control, physician’s clinical point of view and other key factors of the clinical laboratory management. These issues should be explored further in future studies.
Implications
This kind of analysis can be implemented into the work of managers and healthcare experts, physicians and heads of medical laboratories and will improve the effectiveness of any laboratory department or laboratories of different ownership.
Conclusions
Pharmacoeconomic approaches are increasingly used by managers and experts of healthcare in the assessment of health technologies, also including laboratory techniques. The proposed cost-effectiveness methodology, applied to clinical laboratory management, can be the key instrument in the choice of appropriate cost-effective laboratory technique, saving money and improving quality of laboratory diagnostics especially in Ukraine but also other countries.
- Shirobokov VP. Microbiology, Virology and Immunology. Textbook for Higher medical institutions of III-IV accreditation level. Nova Kniga, Vynnitsa 2011 896pp (in Ukrainian)
- Dzyublyk ІV, Gorovenko NG (eds.) Polymerase chain reaction in the laboratory diagnosis of infectious diseases. Kyiv 2012, 219 pp (in Ukrainian)
- Zaitsev IA, Miroshnichenko VA The rapid tests in the diagnosis of viral hepatitis with parenteral mechanism of transmission of pathogens. Laboratory Diagnostics 2005: №2: 41-43
- Dzyublik IV, Samborska JF, Kostenko IG et al, Laboratory diagnosis of infection in terms of practical virology laboratory: Guidelines .Kiyv 2012. 24 p.
- Doan CI, Dove A, Onishchenko AV Laboratory studies in epidemiological surveillance system for influenza and SARS. Preventive Medicine 2012; №1: 0-15
- Doan CI. Rapid tests in the system of laboratory tests for HIV in Ukraine. Preventive Medicine 2011; №1: 4-9
- Kramareva SA, Evtushenko VV, Palatna LO, et al. Flu in children. Current approaches to diagnosis and treatment. Clinical Immunology. Allergology. Infectiology 2010; N98: 1-4
- Felder St., Mayrhofer T.. Medical Decision Making, Berlin: Springer.2011, 200 pp.
- Cook AG. Forecasting for the pharmaceutical industry: models for new product and in-market forecasting and how to use them. Gower Publishing Limited. 2006
- Gnedenko BV. The course of probability theory, 6th ed.] Moskow: Nauka. 1988 (in Russian)
- Von Neumann J, Morgenstern O. Theory of games and economic behavior (2nd ed.). Princeton: Princeton University Press.1947, 776 pp
- Roberts MS, Smith KJ. (2010). Decision Modeling Techniques. Cost-effectivenesss: from theory to practice. (Ed. by Renee J.G. Arnold). Boca Raton: CRC Press (Taylor and Francis Group, LLC): 37-46
- Pastuhov NV, Spichak IV. Design of the information system of drug provision of health facilities. Person and health 2005; N 3:73-79
- Dzyublyk YaO, Obertins'ka OV. Algorithm etiological diagnosis of community acquired lower respiratory tract infections. Ukrainian Pulmonology Journal 2013; N 3: 112-113
- Dzyublyk ІV, Obertins'ka OV, Dzyublik YaO., Sambors'ka І.F., Stepchenkova T.V., Kovalyuk OV, Voronenko SG, Kovalishin GG. Rapid tests for etiologic diagnosis of infectious human diseases, Kiyv: Methodical recommendations: 2013 , 41 pp.
- Tolubaiev V, Zaliska O, Irynchyn G, Piniazhko O, Maksymovych N. COPD in Ukraine: overview of the status and prospects for improvements and developments in health care system. Journal of Health Policy&Outcones Research 2015; № 1: 66-75
- Yagudina RI, Zinchuk IYu. Cost-effectiveness studies of drugs for the diagnosis of tuberculosis infection. Farmakekonomika 2013:Vol.6, N.1: 11-15
- Gajkovaya L B, Vavilova TV, Sirotkina OV. The economic rationale for using the method of flow cytometry to assess the functional activity of platelets in patients receiving antiplatelet drugs. Handbook of Head; N 8: 73-79
- Therapeutic and Diagnostic Device Outcomes Research (Ed. by Stacey J. Ackerman). ISPOR (2011), 332 pp.
- Shillcutt S, Morel C, Goodman C. Cost-effectiveness of malaria diagnostic methods in sub-Saharan Africa in an era of combination therapy. Bulletin of World Health Organization, 2008; Vol. 86: 101-110
- Mahony JB, Blackhouse G, Babwah J. Cost analysis of multiplex PCR testing for diagnosing respiratory virus infections. Journal of Clinical Microbiology 2009: Vol. 47, N 9: 2812-2817