
Pharmaceutical Policies under Economic Crisis: The Greek case
-
Copyright
© 2016 PRO MEDICINA Foundation, Published by PRO MEDICINA Foundation
User License
The journal provides published content under the terms of the Creative Commons 4.0 Attribution-International Non-Commercial Use (CC BY-NC 4.0) license.
Authors
| Name | Affiliation | |
|---|---|---|
Nick Yfantopoulos |
University of Essex |
|
Platon Yfantopoulos |
University of York |
|
John Yfantopoulos |
School of Economics and Political Science, University of Athens
|
Introduction: The purpose of this paper is to critically assess the Pharmaceutical reforms implemented in Greece before and during the economic crisis. The effects of the crisis are multiple in terms of GDP reduction, severe cuts of health and pharmaceutical expenditures and the deterioration of the health status of the population. However, the crisis has been a “window opportunity” to implement the long anticipated reforms in the health sector.
Methods: The analysis is based on Time series data from the OECD Health data source covering the period 1970-2014. Double Logarithmic models are explored to estimate income elasticity for pharmaceutical expenditures. The value of the income elasticity in the Pre-crisis period is 1.72 the highest in Europe. The average annual growth of Pharmaceutical expenditure in the pre-crisis period was 12.3% i.e. the highest among the EU-28 countries and during the crisis this rate dropped to -8.5% the lowest among the EU-28.
Results: The evolution of thePharmaceutical policies and reforms are discussed with reference to HTA, Co-payments, Claw-back and the E-Prescribing. The mixture of both demand and supply side measures resulted in a substantial reduction of pharmaceutical expenditures from 5,6 bil. Euros in 2009 to 2 bil. Euros in 2016. One of the main contributing factors to cost containment policies is the effective launching of E-prescribing. Exclusion and deprivation of citizens of effective and innovative medicinal treatments should be avoided and their access to health services and medicines should be assured. The new strategy in medicinal products should ensure good quality at affordable prices. The Greek Government, in an attempt to reach the Memorandum objective of 1 percent of GDP on pharmaceutical spending should develop incentives to promote the use of generic medicines and the cost-effective use of medicines in general
Conclusions: With all its pros and cons, Greece appears to be an interesting case study to assess the success and failures of the various pharmaceutical reforms implemented.
Introduction
All the European Member States have faced over the last two decades increasing demands for more and better quality health services. Given the commitment of the European health models [1] to the principles of efficiency, effectiveness, equity and universality in the access to health services several reforms have been introduced aiming at improvements of health outcomes in a cost effective way. According to the European Commission's strategy plan (Europe 2020) [2] the member states are essentially responsible for the health of their citizens. Health is in the heart of European policies and it is taken both as improvements of health status as well as the outcome of health services. However, health decisions are taken at a national level because in several treaties it is stated that the European Commission undertakes measures and policies to supplement the work of the Member States. The pharmaceutical sector in the European Union is marked by divergent policies and a fragmentation of the national markets. [3] Substantial differences exist among the member states in the finance and delivery of health services and pharmaceutical care, the epidemiological profile, the standards of living and the demand for and supply of pharmaceutical products. [4, 5] The objective of the European Commission for the completion of a single European pharmaceutical market [6] aims at the demand side to improve patients' access to effective medicines at an affordable price and at the supply side to create incentives for innovative research and sustainable industrial development. The European governments implemented a mixture of health and economic policies to curb the expansionary trends of pharmaceutical expenditure.[7, 8] A wide range of pricing policies was implemented based on product price control, reference pricing (External Price Referencing (ERP)), (Germany, the Netherlands and elsewhere), Value Based Referencing (VBR)[9] and profit control (U.K). [10, 11] Furthermore, the potential substitution of more expensive proprietary brand drugs to generics was proposed, but only a few countries gave the permission to pharmacists to prescribe. Positive lists with reimbursed medicines or negative lists with non-reimbursed medicines were issued by the European Health Authorities in an attempt to control pharmaceutical expenditures. [12, 13]. Copayments were also introduced requiring patients to cover a proportion of the cost of the prescribed drugs. Finally the prescribing behavior of physicians was controlled by issuing guidelines, providing information on less expensive therapies and introducing budgetary controls. The level of success in the implementation of the pharmaceutical reforms varies enormously across the European Countries depending on a large number of factors such as prescribing patterns, industrial policies, and public health measures just to mention a few.[14] Overall the European Commission urges Member States to implement a variety of national pricing and reimbursement policies that fulfill three major objectives: 1) Optimal utilization of scarce resources to maintain a financially sustainable health system, 2) Ensured access to medicines for patients, 3) Reward for valuable and cost effective innovation.
The purpose of this paper is to discuss the launching of pharmaceutical reforms during the economic crisis in Greece and to assess the success and failures of different cost containment policies. The paper is divided into four parts. We start our discussion, in section 1, with a brief glimpse at the economic aspects of the crisis followed in section 2 by a presentation of the Greek Health System and health status trends. In section 3 we present the impact of the crisis on pharmaceutical expenditure and finally in section 4 we focus on the presentation of pharmaceutical policies and reforms in Greece in regards to pricing, reimbursement, co-payments and E-prescribing.
The Economic Crisis
The economic crisis breaks out on September 2008 in the US, followed a year after in Europe with significant impact in the Southern European Countries and Ireland.(8,9) The Eurozone countries and the IMF undertook the responsibility to provide rescue packages to Greece (on April 2010) to Ireland (November 2010) and Portugal (May 2011). The economic crisis had a spiral of adverse effects on the economy and the health status of the population. In comparison to other European countries Greece faced the longest and deepest crisis. In Figure 1 we present the annual GDP growth for the average of the 28 European countries (EU-28) and Greece. In the pre-crisis period Greece presented double rates of economic growth (4%) in comparison to the average of EU-28 (2%). After the year 2009 and during the period 2008-2016 the Greek Economic Drama started with a reduction of GDP by 30%. (See figure 1) During the crisis wages were reduced by 45%, unemployment increased by 276.4% and health expenditure declined by 41%.[15] Income inequality, poverty and social exclusion increased dramatically. Life expectancy was stabilized at around 80 year and infant mortality increased from 2.7 in 2008 to 3.2 in 2010 followed by a subsequent marginal reduction”.
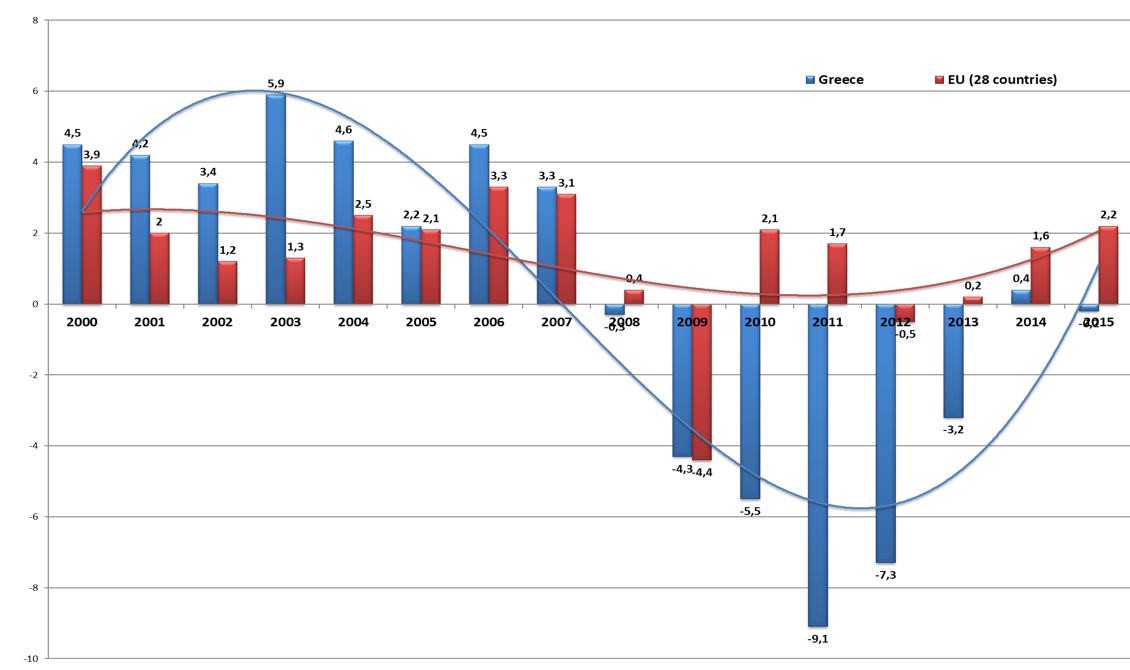
Source: AMECO 2016 European Commission
The European Institutions and the IMF provided three rescue packages to Greece.[16] The first economic adjustment program was signed in May 2010; €110 billion was the value of the package agreed between the Greek government and the so called Troika consisting of: the European Commission, The European Central Bank and the IMF. The second adjustment program was signed in February 2012 worth €130 billion and the third one in June 2015 amounted to 86 billion Euros.The signed terms of these bailouts included a series of measures such as the liberalization of several protected economic and employment sectors, the reduction of public expenditure, the fight against corruption and the underground economy, the control of health expenditure, and the implementation of an austerity package.
The Health System in Greece
The health system in Greece presents the features of the Southern European model based on the mixture of: 1) insurance based principles in the finance and delivery of health services (Bismark -German model) and 2) the universality in coverage, access and utilization of services (Beveridge - Anglo-Saxon model).[17] Health care is provided by a three party system i.e. 1) the public sector (National Health Service NHS), 2) the Insurance Organizations and 3) the private sector. The Ministry of Health and Social Solidarity is responsible for the overall organization, financing and delivery of health services. Prior to 2010 the health system in Greece was fragmented with an overlapping of services, high administrative cost and lack of incentives for economic efficiency and equity in the delivery of services. There were a large number of social insurance funds for the self employed (IKA), the farmers (OGA), the civil servants (OPAD), and the merchant (OAEE) covering almost 100% of the Greek population. The system was linked to the employment status with high inequities in the provision and financing of the health services. Since the 1968’s several efforts were undertaken by different governments to merge the numerous insurance funds under a unified system without success. In the 2010’s, after the adoption of the economic adjustment program and the passage of Laws 3863/2010 and 3918/2011 efforts were undertaken by the Greek Government to harmonize the different insurance schemes by pooling the health risks under a unified system, harmonizing the benefit packages and merging the insurance funds into a single health insurance fund called EOPYY “The National Organization for the Provision of Health Services”. EOPYY was established under the Legislative act 3918/2011 and is a public corporate body supervised by the Ministry of Health (MoH).[18] It started its operation as a single buyer of health care services in June 2011 and covers today the total population of Greece. Table 1 presents the number of insured inhabitants in Greece under EOPYY for the year 2014.
|
Table 1: Insured and uninsured inhabitants in Greece 2014 |
||||
|
Social Security Funds |
Uninsured |
Insured |
Total |
% Uninsured /Total |
|
IKA |
1.989.749,00 |
3.340.740,00 |
5.330.489,00 |
37,3% |
|
OGA |
161.326,00 |
1.484.014,00 |
1.645.340,00 |
9,8% |
|
OAEE |
160.537,00 |
855.159,00 |
1.015.696,00 |
15,8% |
|
OPAD |
68.882,00 |
1.238.558,00 |
1.307.440,00 |
5,3% |
|
ETAA |
36.479,00 |
142.187,00 |
178.666,00 |
20,4% |
|
ESAA |
29.150,00 |
120.125,00 |
149.275,00 |
19,5% |
|
Oikos Nautou |
28.823,00 |
132.521,00 |
161.344,00 |
17,9% |
|
OTE |
19.220,00 |
108.267,00 |
127.487,00 |
15,1% |
|
Rest |
30.077,00 |
243.850,00 |
273.927,00 |
11,0% |
|
Total |
2.494.166,00 |
7.421.571,00 |
9.951.737,00 |
25,2% |
|
Source: Ministry of Labour, Atlas, 2014 |
||||
In March 2012, the passage of Law 4052 introduced a new impetus in the reorganization and restructuring of the Greek National Health Service System (NHS) aiming at reducing inefficiencies, promoting economies of scale and scope, improving the quality of services and ensuring greater access to health services. Over the period of the last five years new policies were introduced in hospitals by implementing a DRG System, in the primary care, the diagnostics, and the pharmaceutical sector. During the economic crisis the pharmaceutical sector has been particularly active. The number of pharmaceutical companies increased from 87 in the pre crisis period to 94 in 2015. According to SFEE 2016 estimates the pharmaceutical sector contributes to the Greek Economy by 4% (EUR 7.55 billion).
Health Status
Over the past five decades, and throughout the pre-crisis period life expectancy and health status have risen steadily in Greece like the rest of the European Countries. The gain in life expectancy since the 1950's, in the EU-28 countries is estimated to be around 10 years on average. The average life expectancy in the year 2014 is 78.1 for men and 83.6 for women. Similar improvements in longevity and health status have been recorded in Greece, since the 1950's reaching the level of 78.9 years for men and 84.1 years for women in 2014. Infant mortality has declined significantly over time in Greece from 43.52 infant deaths (per thousand live births) in 1955, to less than 3.8 infant deaths (per thousand live births) in 2014. The main causes of death are cardiovascular diseases accounting for 30% of total deaths, followed by neoplasm’s (24.6%), cerebrovascular (16.4%) and respiratory diseases (7.8%). The health gains observed in Greece are mainly attributed to improvements in living conditions, Mediterranean diet, better access to health services and pharmaceutical care. [19] This argument is supported by several health interview surveys conducted by the Health Economics research unit at the University of Athens [15] and other academic institutions.
Figure 2 provides a clear comparative view on the effects of the economic crisis on the health status of the Greek population. From a wide range of mortality and morbidity indicators we have selected the Human Development Index (HDI) [20] which is a composite indicator highlighting the health status of a Country in conjunction with the its living standards. The HDI is the geometric mean of three normalized indexes: i) Life Expectancy at birth, ii) Education measured in terms of years of schooling iii) Standards of living measured by Gross National Income per Capita.
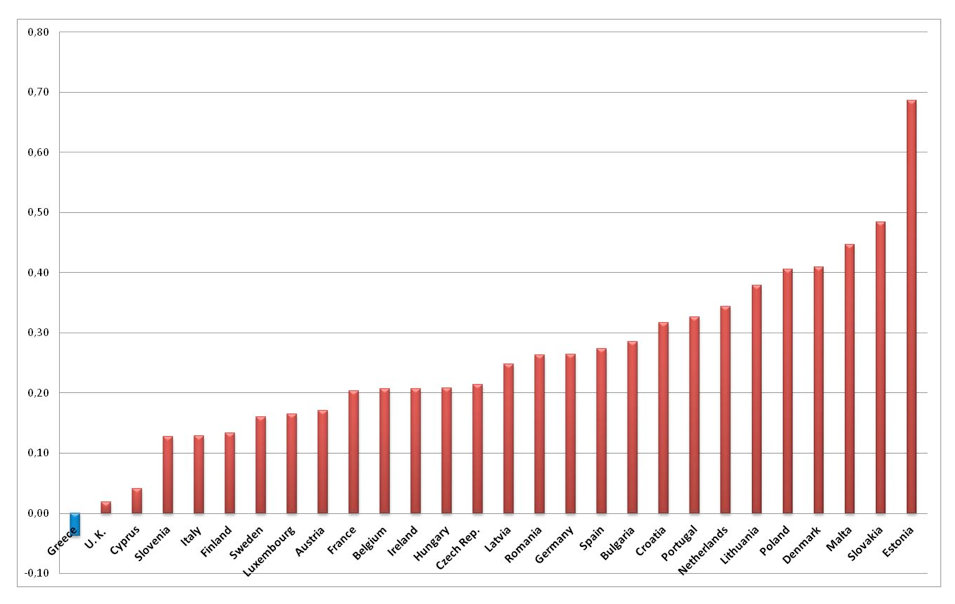
Source H.D.I. Indexes 2015
Examining the dynamics of the HDI across the twenty eight European Countries (EU-28) we witness that Greece is the only exception with a negative annual rate of change over the crisis period 2010-2014. The rest of the Southern European Countries along with the Ex-Eastern European countries present impressive positive developments in the HDI index. The deterioration of the HDI in Greece is mainly attributed to the Gross National Income decline of more than 25% over the period 2010-2014.
Health Related Quality of Life Research
The academic and research community in Greece, following the ISPOR tradition has explored several methods in measuring the health status of the population, or sub-groups of populations as well as the health outcomes of several pharmaceutical therapies. Both populations based (generic), and disease specific instruments have been translated, validated and culturally adopted in order to assess health related quality of life. The EQ-5D and the 15D are some indicative generic instruments used for the measurement of health status.[21,22] These instruments were incorporated in large health interview surveys conducted by research and university institutions. The Greek version of the EQ-5D instrument [23] was used by the authors to a randomly selected sample of 5,500 individuals (53.3% women, 46.7% men) living in the Athens Area to estimate health related quality of life indexes before and during the crisis. Subjects were asked to self rate their health on a Visual Analogue Scale (EQ-VAS) before and during the crisis. The EQ-VAS before the crisis was VAS Before= 86.06 and the corresponding value during the crisis was VAS During = 76.72. The significant reduction in EQ-VAS was also associated with greater inequalities in the distribution of health.
Economic crisis and pharmaceutical expenditure
According to OECD health data[24], Greece spent US$278 per capita on pharmaceuticals in 2000, an amount which is much lower in comparison to other Southern European Countries (Italy US$427, Spain US$327, and Portugal US$327). Within the period of 2000-2009 pharmaceutical expenditure increased exponentially in Greece by more than 219% reaching the level of US$888 in 2009 being the highest among the European Nations. (see figure 3). The Pharmaceutical expenditure in Greece has reached a level which is much higher than the Southern European Countries as well as Germany and the rest of Western European Nations with well developed Health Care and Pharmaceutical Systems.
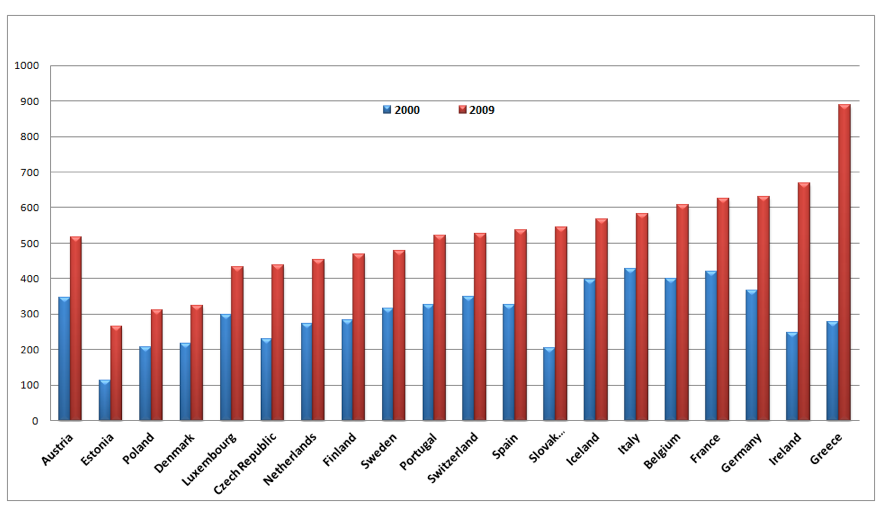
Source: OECD Data base
In an attempt to further investigate this phenomenon, we make use of a simple double logarithmic model assuming the following form:
Log (TPE) = a + b Log (GDP) + u (1)
where :
TPE = Total (public and private) Pharmaceutical Expenditure per capita
GDP = Gross Domestic Product per capita
The econometric findings of the above model are shown in table 1 indicating a statistically significant relationship Pharmaceutical expenditure and GDP. The estimated value of the coefficient of determination R2 shows that the empirical models can explain more than 95% of the evolution of pharmaceutical expenditure in Greece.
|
Table 2. Regression analyses between Pharmaceutical Expenditures and GDP |
||||
|
Dependent Variable: Logarithm of THE |
||||
|
Variables |
Coefficient |
Std. Error |
t-Statistic |
Prob. |
|
Constant |
-14.364 |
1.026 |
-13.998 |
0.0000 |
|
Log of GDP |
1.7145 |
0.072 |
23.595 |
0.0000 |
|
R-squared |
0.955 |
Adjusted R-squared |
0.954 |
|
Figure 4 presents diagrammatically the results of the above model. Greece appears to be the Country with an income elasticity of 1.72 which is the highest in comparison to the rest of the European Countries. An increase of GDP by 10% in Greece resulted to an increase in pharmaceutical expenditure by 17% revealing an exponentially increasing trend of pharmaceutical expenditure for the pre-crisis period.
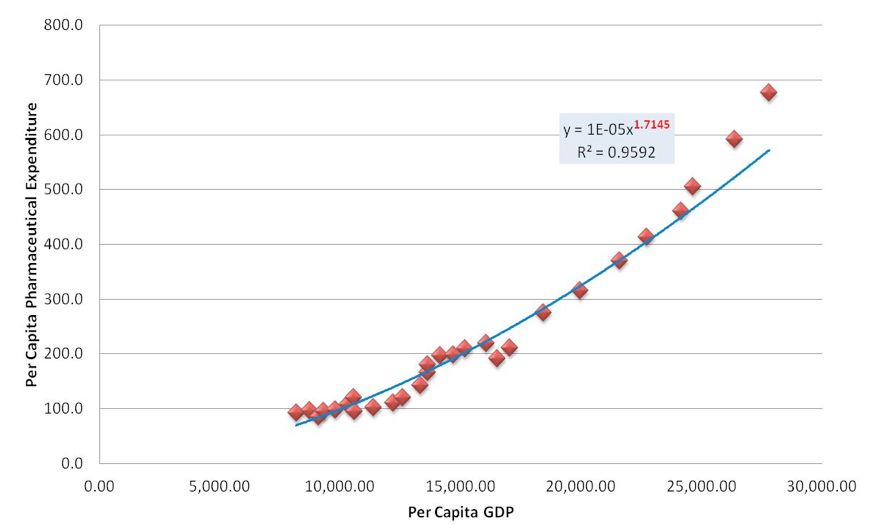
Source: Authors’ estimates
Examining the evolution of pharmaceutical expenditure in the EU-23 Countries in the pre-crisis period 2005-2009 and comparing it with the post crisis period 2009-2014 (see figure 5) we reach the conclusion that Greece appears to be an outlier in both periods under consideration. In the Pre-crisis period 2000-2009 the annual rate of pharmaceutical expenditure in Greece was the highest among the EU-23 countries reaching the level of 12.3% per annum. The average annual growth rate among the EU-23 countries was much less at a rate of 1.4% with much lower or even negative rates among the rest of the Southern European Counties (Spain 0.6%, Portugal -1%, Italy -1.8%). During the economic crisis 2009-2014, the economic drama became even more apparent in Greece, in comparison to the rest of the EU-23 countries, as a big spender country turned into the lowest spender with an annual declining rate of -8.5%. Figure 4 depicts the extreme phenomena of increasing and declining trends in Greece.
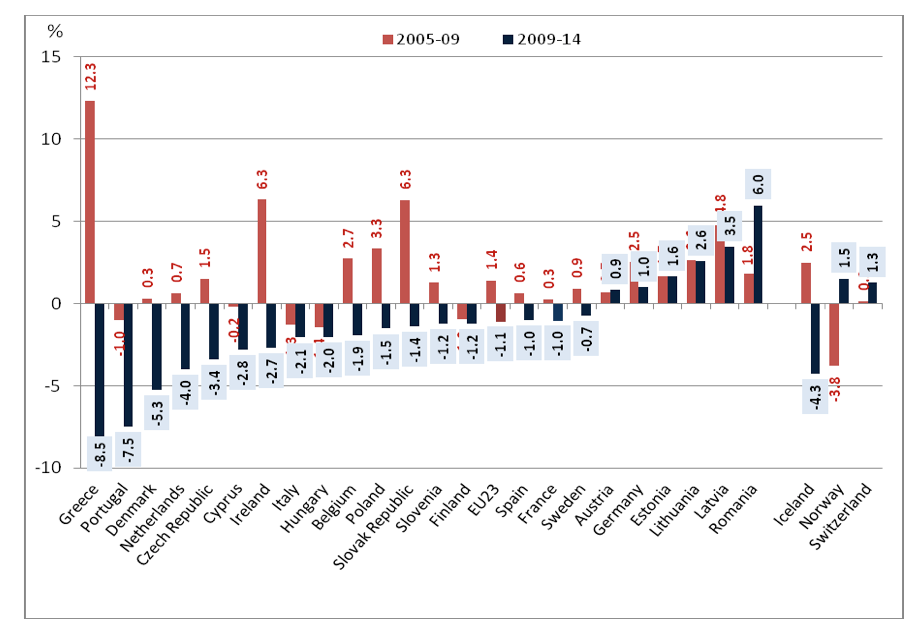
Source : OECD 2016 Health at a Glance
The cost containment policies adopted in the pharmaceutical sector during the period 2009 -2015 resulted to a significant reduction in drug expenditures. In order to investigate the overall effects of the pharmaceutical reforms during this period we specify the following econometric model:
TPE = a + b GDP+ Reforms + u (2)
where :
TPE = Total (public and private) Pharmaceutical Expenditure per capita
GDP = Gross Domestic Product per capita
Reforms = A dummy variable for the period
|
Table 3: Regression analyses. The effects of reforms on Pharmaceutical Expenditures |
||||
|
Dependent Variable: PHA |
||||
|
Variables |
Coefficients |
Std. Error |
t-Statistic |
Prob. |
|
C |
473.9026 |
810.1191 |
0.584979 |
0.5997 |
|
GDP |
0.016585 |
0.029715 |
0.558135 |
0.6157 |
|
Reforms |
-52.75561 |
15.35185 |
-3.436434 |
0.0413 |
|
R-squared |
0.851 |
Adjusted R-squared |
0.752 |
|
The econometric findings of the above model (2) indicate a statistically significant impact of the implemented reforms on the control of pharmaceutical expenditures. On average, the annual reduction of per capita pharmaceutical expenditure, during the period of the reforms 2010-2015 accounted to 53 Euros. The estimated value of the coefficient of determination R2 shows that the empirical model (2) can explain a significant proportion (more than 85%) of the trends of pharmaceutical expenditure in Greece.
Pharmaceutical Policies and Reforms in Greece
Several reforms have been implemented in the pharmaceutical sector in Greece aiming at cost containment, re-organization of services, and enhancing efficiency. The overall responsibility for medicinal regulation is under the Ministry of Health. (MoH). A prerequisite for price setting in Greece is the marketing of the product in at least one European country following the decision of the European Medicinal Association (EMA). The responsibility for the pricing of pharmaceuticals lies within the Ministry of Health, under the Pricing Committee which issues official prices based on an External or International Price Referencing (EPR) system. The prices of pharmaceuticals are regularly published in a Price Bulletin which is distributed to all pharmacies. The price regulation process is based on an agreement between the Country's Health Authorities and the Pharmaceutical Industry. Over the last two decades we have witnessed three major faces of pharmaceutical reforms. The first face refers to the introduction of a positive reimbursement list in 1998 and an EPR system based on the lowest price among the 15 EU Member States. The main criterion for the inclusion in the positive list was the daily treatment cost. The second face of reforms is related to the passage of Law act 3457 enacted in May 2006 aiming at: 1) the abolishment of the positive list in 2006, 2) the launching of a rebate system paid by the pharmaceutical industry to the Social Insurance Funds and 3) the introduction of a new EPR system where prices for all medicinal products which were manufactured, packaged or imported in Greece were determined on the basis of the three lowest prices among the EU countries, two of which were selected from the previous EU-15 states including Switzerland and the third from the new accession countries that joined the EU after 2004. According to Law 3457/2006, all prescribed medicines were reimbursed by the Social Insurance Funds. The only non-reimbursed products were the over the counter (OTC) and lifestyle drugs. The philosophy behind this reform was to increase patient access to new and effective drug therapies. However the reform did not take into account the vast European experience on economic evaluation and health technology assessment. It should be noted that both 1998 and 2006 reforms were inefficient in controlling the continually increasing pharmaceutical expenditure.
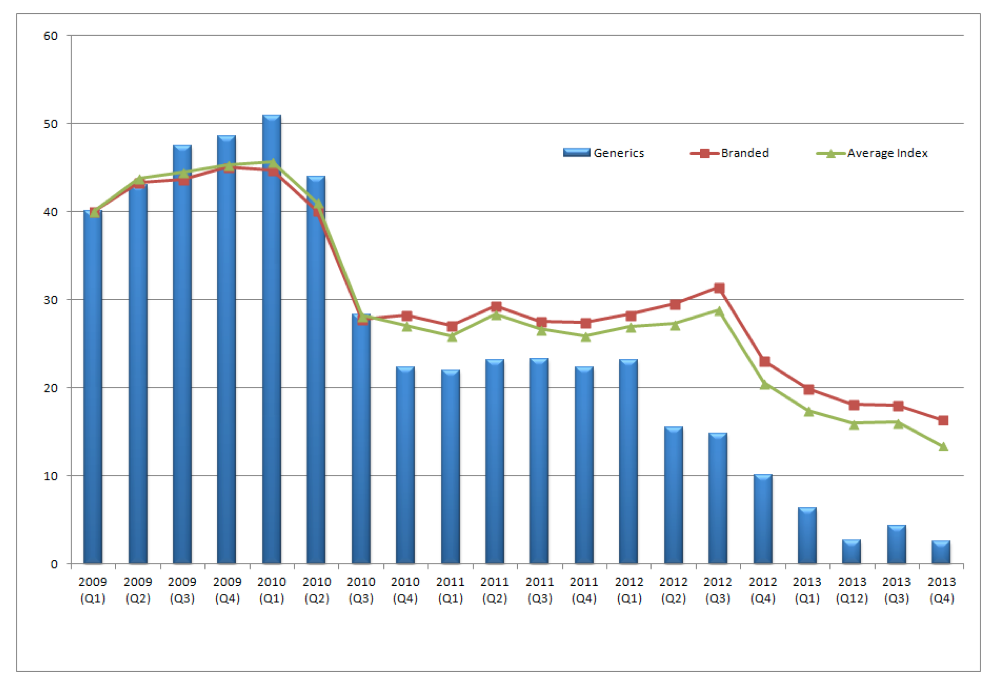
The third face refers to the economic crisis and the need for structural reforms aiming at boosting efficiency, competitiveness and transparency of the health system. In the Economic Adjustment Programme signed in May 2010 it was stated as one of the main targets to reduce public expenditure on health to levels below 6% of the GDP and decrease public expenditure on medicines to 1.33% of GDP in 2012 and 1% in 2014. The Greek government in an attempt to control the cost of pharmaceutical care introduced in 2010 horizontal cuts in all drug prices by 20%.[3] Despite the drastic action the objective was not achieved because pharmaceutical expenditure remained at 2.6% of GDP. Pricing has changed since 2013 with the passage of new legislation enforcing pricing twice a year. For each therapeutic category a reference price (ΑΤ) is calculated based on formula which takes into account the cost of daily treatment (ΚΗΘ). This is calculated separately for each therapeutic category. It represents the compensation price paid by the insurance funds such as EOPYY (PEDY) for all pharmaceutical products. A new formula is applied to off-patent medicines based on either the lowest price between the average of the three lowest prices in EU-23 or at the50% level of the price before patent expiration. Generics are priced at 65% of the reference medicine before expiration for those medicines having entered the market since 2012. Dynamic pricing for generics has been introduced in order to make them more attractive to consumers/patients. The effects of this policy are portrayed in figure 6 where Generics price index was reduced by 37 percent where the corresponding average price index was reduced by 25 percent over the period 2009 to 2013. (See figure 6)
Recent decisions on reimbursement of innovative drugs in Greece requires effective reimbursement decisions in 14 EU Countries seven of which should be voluntary participating in Health Technology Assessment Systems (HTA).
Overall pricing and reimbursement policies in Greece have been implemented through a variety of legislative acts and Ministerial decisions of which the most important ones in a chronological order are the following: Legislative Decree 96/1973, Law 4336/2015, Law 4337/2015 and Ministerial Decision 28408/2016
In an attempt to evaluate the three faces of pharmaceutical reforms discussed above, we witness that in the pre-crisis period Greece was the champion among the EU countries in excess pharmaceutical consumption and over-prescribing drugs. It has been shown above that according to EU-23 statistics; the pharmaceutical expenditure in Greece had been at the highest levels in comparison to other EU countries with the same population. Structural problems, corrupted bureaucracy, lack of public governance, lack of e-prescribing for monitoring consumption, very high distribution margins and deficiencies in the drug chain from Government to pharmaceutical companies were among the contributing factors to this phenomenon [25].
In the signed memorandum between the Greek Government and Troika it is stated that outpatient drug expenditure should be reduced to the level of 2.0 billion euro at the year 2015. In order to attain this objective, the Greek government has launched a series of cost containment policies to control over prescribing and waste of resources in the pharmaceutical sector. Table 2 briefly presents the policy interventions for the control of pharmaceutical expenditure.
Table 4. Government’s measures to control pharmaceutical expenditure
|
|
|
|
|
|
|
|
|
|
|
|
|
|
|
|
The results of these policies are portrayed in figure 7 where a reverse of the previous upward trends is observed and Greece fulfilled the objective of spending around 1.0 % of GDP on pharmaceuticals by the end of 2015.
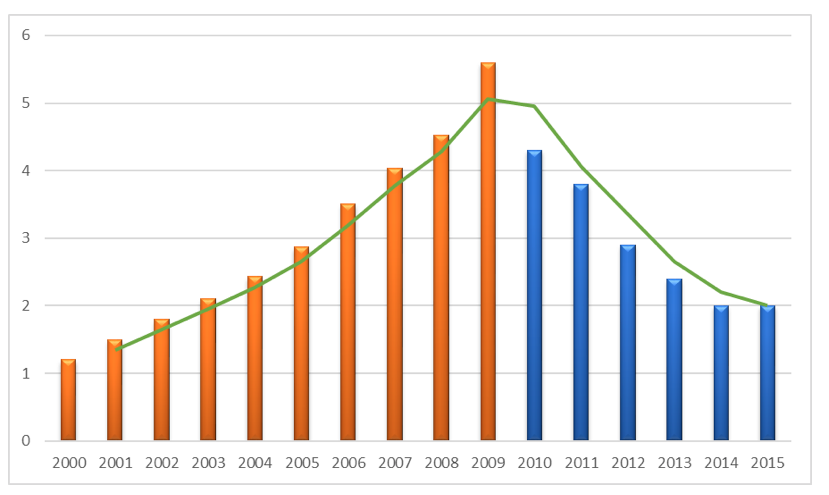
Source: National Statistical Service of Greece
In the subsequent part of this section we discuss in detail the pharmaceutical policies in Greece in regards to four major interventions: HTA policies, out of pocket/co-payments, Clawback/Rebates, and E-prescribing.
HTA Policies
Greece is the only European country without an HTA (Health Technology Assessment) organization. In a Legislative Act 3457 passed in 2006 under Article 11 an HTA organization was proposed called OATY. The purpose of the agency was to assess new therapeutic interventions, health technology, clinical practices, diagnostics and disease management. The Ministry of National Economy expressed some “reservations” and at the very last minute article 11 was removed from the legislative act No:3457/2006. Greece failed to take into consideration the vast European experience on Health technology assessment for the reimbursement of new drugs and health technologies. It should be noted that, over the last decades several (HTA) institutions have been established across Europe aiming at a synthesis of several criteria for the assessment of new drugs, and new technologies. A wide range of criteria has been developed based on: i) safety, ii) efficacy iii) clinical effectiveness, and iv) cost effectiveness or cost utility, which have been used in conjunction with broader legal, ethical and societal aspects. In England and Wales for example, the National Institute for Health and Clinical Excellence (NICE) recognizes a number of criteria by applying “special weightings”.[26]
“Decisions about whether to recommend interventions should not be based on evidence of their relative costs and benefits alone. NICE must consider other factors when developing its guidance, including the need to distribute health resources in the fairest way within society as a whole.” (Nice 2008 p.18) [27]
Table 5 provides an overview of the National HTA bodies in 15 European Countries.
|
Table 5. HTA Institutions in Europe |
|
|
EU Countries implementing HTA |
Body Responsible for HTA |
|
AUSTRIA |
Austrian Institute of Technology Assessment – Ludwig Boltzman Institute of Health Technology Assessment |
|
BELGIUM |
Medicines Reimbursement Commission (CRM), Ministry of Economic Affairs (MEA), The Belgian Healthcare Knowledge Center (KCE) |
|
DENMARK |
Danish Centre for Evaluation and Health Technology Assessment (DACEHTA) |
|
FRANCE |
Haute Autorité de Santé (HAS) Agence Nationale pour le Développment de l’Evaluation Médicale (ANDEM) |
|
GERMANY |
The Institute for Quality and Efficiency in Health Care (IQWIG) |
|
IRELAND |
Health Information and Quality Control (HIQA) |
|
ITALY |
AIFA (The Italian Medicines Agency), Regions (impact on access) |
|
NETHERLANDS |
College voor Zorgverzekeringen (CVZ) – healthcare Insurance Board, Ministry of Health, Welfare and Sports (MOH) |
|
NORWAY |
Norwegian Knowledge Centre for the Health Services (NOKC) |
|
POLAND |
Agency for Health Technology Assessment in Poland (AOTM) |
|
PORTUGAL |
Directorate-General of Economic Activities (DGAE), National Institute for Pharmacy and Medicines (INFARMED) |
|
SPAIN |
Agencia de Evaluación de Technologias Sanitarias, Instituto de Salud Carlos II, España (AETS) |
|
SWEDEN |
Swedish Council on Technology Assessment in Health Care (SBU), The Dental and Pharmaceutical Benefits Agency in Sweden (TLV), Institute of Health Economics (iHE) |
|
SWITZERLAND |
Swiss Centre of Technology Assessment (TA-SWISS) |
|
UNITED KINGDOM |
National Institute for Health and Clinical Excellence (NICE) |
Following the European experience and after considerable delay, the Greek Government Gov. passed on 14 August 2015 (Gov. Gazette Number 94) , the establishment of an HTA organization which will start functioning after two years of proper planning and coordination between the administrative bodies of : i)the Ministry of Health, ii) the National Drug Organization (EOF), iii) EOPYY and the academic institutions. Recently, on 11th January 2017, EOPPY, decided to become an official member of the EUnetHTA network. [28] Furthermore under the memorandum signed between the Greek Government and the European Institutions an HTA organization is expected to start functioning within 2017.[29] The legal status, the functioning, and the organizational structure of a Greek HTA are not yet discussed. However, in the process of establishing such an institution is worth taking into consideration some of the principles proposed by Drummond at al. (2008). [26]
In general, there are 10 core aspects that underpin HTA processes and Drummond in his seminal work identified ten principles. Firstly, as it was briefly mentioned above, HTA should be explicit in its goal and its scope should be relevant to the health system it aims to inform. Secondly it must be a transparent and objective process, hence is best left upon an independent body to perform. Thirdly given the wide scope of its character, as many technologies as possible should be compared to get a holistic view and fourthly the same procedure has to be followed across all these technology investigations. Hence the decision around the use of resources will not be distorted. This method of assessment should, fifthly, be appropriate to treat the costs and the benefits with access to expert opinion and clinical data to achieve so. A sixth principle is the synthesis of data should draw from a pool of studies as possible with fully and quasi- experimental, observational and qualitative work all used integrated to inform the decision. Additionally, a seventh point already mentioned is the societal perspective being the best choice for the treatment of costs. An eight principal which is very important is that uncertainty should be treated explicitly given the underlying distributions of the data and sensitivity analysis should always be used to treat it. Ninth there should be consideration of the generalisability of the results and how transferable they are to other studies used for comparison and contexts. Finally, the tenth principle is that quite logically the HTA process must engage all relevant stakeholders in the process.
All these principles should be considered to optimize the relevance and cost-efficiency of an HTA process. Taking this a step further there is a new collaborative project called the EUnetHTA Project that aims in bringing together all the HTA analysis performed in the various European countries under an umbrella used to enhance the process and promote more efficient use of resources by standardising HTA studies and in so helping countries identify previously established results and seek out new areas of research interest that are waiting for more informed HTA studies.
The overall contexts of HTA processes are to give more information on cost-effectiveness. However, the previously described health system has a wider scope and should consider issues of both long-term sustainability and access of care. After all, tackling existing inequalities is a huge issue for a health system. Value-based pricing should hence be also considered when talking about HTA. In considering need maybe the inherent value of a product should be considered first, and much more than purely the cost of the product.
Conclusively HTA is a good process to ensure cost-effectiveness for a health system and should be adopted by all EU countries. The above criteria along with the existing European experience would be most valuable towards the implementation of an HTA reform in Greece.
Co-Payments
According to OECD data a large number of European Countries (Cyprus, Czech Republic, France, Greece, Ireland, Latvia, Portugal, Slovenia, and Spain) are introducing increasing copayments in prescribed drugs. In Greece three types of copayment have been introduced: 25% for all drugs in positive list, 10% for chronic cases (diabetes) and 0% for cancer, end stage and renal dialysis patients. Specifically: a) 25 percent Copayment: for all the drugs included in the positive list issued by The National Drug Organization EOF, the Greek patient has to pay 25% of the cost of the drug. b) 10 percent copayment refers to chronic cases and c) Zero-Copayment for patients having undergone transplant of solid or liquid organs and tissues, patients at the end stage of a chronic renal disease with renal dialysis, as well as paraplegics and quadriplegics do not pay any participation for all medicines administered for the treatment of their condition. The severe cuts in public pharmaceutical expenditures resulted to a shift of drug cost from the public sector to the patients and the household budget. During the economic crisis, the out of pocket co-payment increased substantially, (almost tripled), from 9% in 2009 to 26% on average in 2015.
Claw-Back
Claw Back is a method introduced by the signed memorandum between the Greek Government and the European institutions for the control of pharmaceutical expenditure. According to the Claw Back “philosophy” the budget for pharmaceutical expenses for all social insurance agencies cannot exceed a certain amount of pharmaceutical expenses. In the case of the year 2012 when claw back policies were introduced the ceiling expenses in Euros including the Value-Added Tax for 2012 amounted to 2,880 mil Euros. This amount is proportionally allocated to each Social Security Agency, in accordance with its approved budget. The monthly expenditure of each social security Agency cannot exceed 1/12 of the sum registered in the annual Budget. Any amount in excess is calculated on a six month basis. In case that at the end of each six-month period, the total pharmaceutical expenditure has exceeded the predetermined amount, the balance is sought to be paid and is paid by the pharmaceutical companies to Government on the base of the special account suggested by each Agency. According to EOPYY data the average rate of claw back stands at 18.22%. Specifically, the lowest rate of 10%-15% claw back is paid by 18 companies, the medium rate of 16%- 20% is paid by 147 companies and the rest 21%- 28% is paid by 45 companies. Based on EOPYY data the pharmaceutical companies have paid 97% of the total claw back for the years 2012 and 2013, around 92% for the year 2014, and 85% for the year 2015. Almost all the pharmaceutical companies seem to be particularly consistent in their repayments to EOPPY. As it has been recently proposed by EOPYY the different refund rates will be incorporated into a single calculation formula and some possible reductions are expected to be introduced in the year 2017 accounting to 130 mil Euros for outpatient drugs. The focus of the policy will be to control the volume of prescriptions and to strengthen the role of negotiating committees.
|
Table 6. Rebates and Claw back paid by the pharmaceutical industry and in public pharmaceutical expenditure (in mil Euros) 2012-2014 |
|||||
|
Year |
Industry Rebates |
Industry Claw back |
Total |
Pharmaceutical expenditure |
% participation of industry in pharma expenditure |
|
2012 |
€193 mil . |
€78 mil . |
€271 mil . |
€2,880 mil . |
9 .4% |
|
2013 |
€177 mil . |
€153 mil . |
€330 mil . |
€2,371 mil . |
13 .9% |
|
2014 |
€226 mil . |
€ 204 mil . |
€430 mil . |
€2,000 mil . |
21 .5% |
E -prescribing
An important element in controlling medicinal product expenditures is electronic prescribing (e-prescribing). The lack of electronic patient records in primary and hospital care in Greece has led to improprieties and the uncontrollable growth of expenditures for health and medicines. There was no random, even manual, control of prescriptions, nor computerised control, nor e-prescribing within the e-health framework. The Insurance Organisation for the Self-Employed (OAEE) was the first insurance fund launching a monitoring mechanism. The results were very impressive because OAEE managed to reduce medicinal product expenditures by 50% as a result of introducing e-prescribing. Specifically, the total monthly expenditure for medicines was reduced from €25 million before the introduction of e‑prescribing to €13 million after it was implemented. In addition, with regard to the number of monthly prescriptions, a sharp drop has been noted, from 300,000 monthly to 200,000, while the cost of the average prescription has dropped from €80 to €48.
The Greek e-prescription system, by active substance (INN) was introduced in 2010, as a compulsory memorandum requirement and was legally reinforced with the passage of Law Act 3892/2010. A digital platform was established at the Ministry of Social Security with the aim to connect and inter-operate all the Greek Social Insurance Funds. The e-prescription system covers a network of 11,900 pharmacies and 43,000 doctors offering services to 10 million Greeks and supports the management and monitoring of drug prescription, visits to doctors, referrals to laboratory tests and the electronic medical acts. It has been proven to be an effective tool for planning, improving the quality of services and containing substantially the unnecessary pharmaceutical expenditure and the excess utilization of services. The simplicity of the system provides great benefits to both the demand (patients), and supply side (doctors, pharmacists, pharmaceutical companies). It improves substantially the transparency, and fights corruption, and bureaucracy. It is worth mentioning that before the establishment of the e-prescription system there were many reported cases of fraud and polypharmacy. There were certain cases where the doctors prescribed 10 prescriptions per month for the same patient with 20 different drugs. There were also some chronic patients who consumed more than 15 different medicines per month. According to some estimates around 50% of the total cost for the electronically prescribed drugs was allocated to 87 commercial drugs, (150 compounds) and as much as 80% of the total budget for drugs was devoted to 319 commercial drugs (555 compounds). Currently the E-prescription system covers 99% of the Greek population (see table 4) and has achieved, along with the rest of the implemented measures a substantial reduction in the pharmaceutical expenditures from 4.5 billion Euros in 2010 to 2.0 bn. Euros in 2016.
|
Table 7. The evolution of E-Prescription in Greece |
||||||||
|
|
September 2015 |
September 2016 |
July 2016 |
August 2016 |
||||
|
Number Of Prescriptions |
% |
Number Of Prescriptions |
% |
Number Of Prescriptions |
% |
Number Of Prescriptions |
% |
|
|
Handwritten |
53747 |
0.95% |
34039 |
0.55% |
37078 |
0.61% |
40470 |
0.70% |
|
E-Prescriptions |
5632142 |
99.05% |
6158999 |
99.45% |
6087991 |
99.39% |
5722090 |
99.30% |
|
Total |
5685889 |
6193038 |
6125069 |
5762560 |
||||
The effectiveness of e-prescribing in Greece is depicted in figure 8 presenting the proportional decline in the average pharmaceutical expenditure per capita for each of the eleventh health regions during the years 2013-2014.
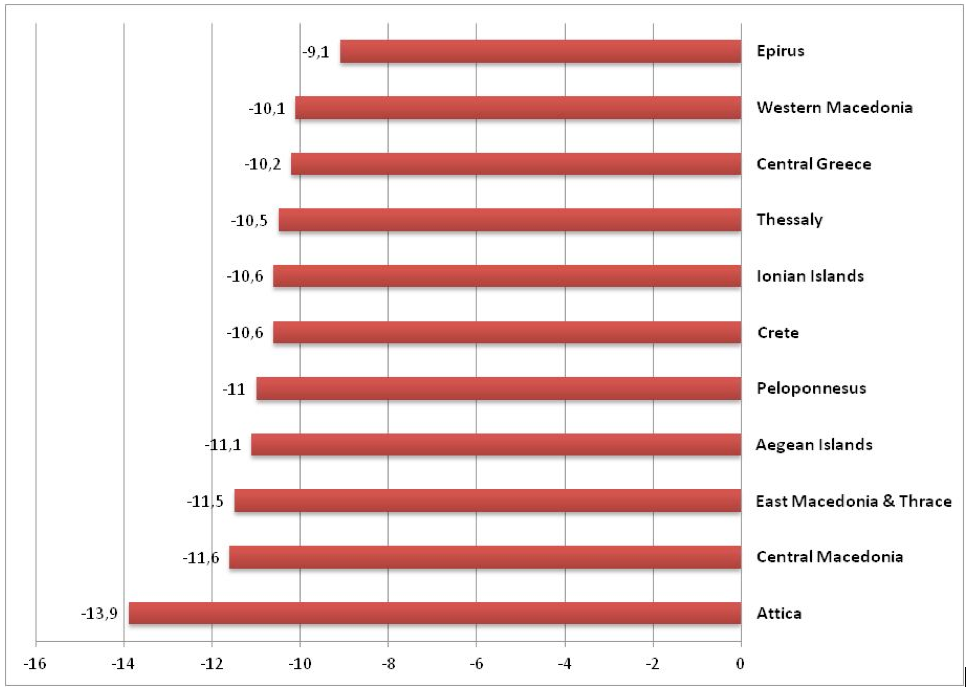
Source : EOPYY 2016 data source
The most indicative cost containment results, due to E-prescribing are observed in Attica (reduction by – 13.9%) where the majority of the Greek population is situated. Epirus appears to be in the lowest part of the distribution with a corresponding decline in average per capita pharmaceutical expenditure by -9.3%.
Conclusions
Over the last decade, several policies have been introduced in the pharmaceutical sector across the Central and the Eastern European Countries aiming at controlling the pharmaceutical expenditures by expanding HTA systems and promoting Health Economics and Outcome Research capacities (HEOR). The European Commission, the OECD, the World Bank and the World Health Organization have all played an important role during the economic crisis in providing valuable scientific tools and financial aid to achieve greater efficiency, long term sustainability and equity in access in the European pharmaceutical and health care systems
Greece is at a crossroad of reforms and represents a good example of both success and failures of Pharmaceutical policies. The crisis is not solely economic or social, but also affects healthcare with a significant impact on the elderly, the unemployed and women who constitute the most vulnerable social groups. In addressing the crisis, e-prescribing and streamlining of the health system's IT infrastructure must be completed as soon as possible. Exclusion and deprivation of citizens from effective and innovative medicinal treatments should be avoided and their access to health services and medicines should be assured. New strategies in medicinal products should ensure good quality at affordable prices. The Greek Government, in an attempt to reach the Memorandum objective of 1 percent of GDP on pharmaceutical spending should develop incentives in the supply (industry, pharmacies, doctors) as well as in the demand side (patients) to promote the use of generic medicines and the cost-effective use of medicines in general
The “Greek case” offers a good example for further investigation on how we should learn from the past and realise that decisions made during the economic crisis will have an important impact on the future of the economy and society as a whole. It is up to us to ensure a long-term, viable economic environment for our children and future society. Public policy in the area of medicinal products should be reviewed carefully so as to avoid the mistakes of the past. The “Greek case” could contribute vitally to the debate of implementing effective and efficient reforms in the health and pharmaceutical sectors at the European level.
Acknowledgements
We are very grateful to the participants of the 14th International Conference of the Polish Pharmaco-Economic society which took place at Warsaw on 2nd and 3rd December 2016 for their valuable comments and criticism received during the presentation of the paper. We also thank the Editor in Chief Professor Karina Jahnz-Rozyk and the Deputy Editor in Chief Dr Joanna Lis for their review and their useful comments on previous drafts. Sincere thanks are also due to two independent reviewers who provided constructive comments to an early version of the paper. All possible errors and omissions are the sole responsibility of the authors.
1. European Commission. Investing in Health. Brussels: European Commission, 2013 Contract No.: SWD(2013) 43 final.
2. WHO. Health 2020: a European policy framework supporting action across government and society for health and well-being. Malta: World Health Organization Regional Office for Europe, 2012.
3. Carone G, Schwierz C, Xavier A. Cost-containment policies in public pharmaceutical spending in the EU. Available at SSRN 2161803. 2012.
4. Vogler S, Zimmermann N, Leopold C, de Joncheere K. Pharmaceutical policies in European countries in response to the global financial crisis. Southern Med Review. 2011;4(2):22-32.
5. Yfantopoulos J. Pharmaceutical pricing and reimbursement reforms in Greece. European Journal of Health Economics. 2008;9(1):87-97.
6. Aaserud M, Austvoll‐Dahlgren A, Kösters JP, Oxman AD, Ramsay C, Sturm H. Pharmaceutical policies: effects of reference pricing, other pricing, and purchasing policies. The Cochrane Library. 2006.
7. Baltagi BH, Moscone F. Health care expenditure and income in the OECD reconsidered: Evidence from panel data. Economic Modelling. 2010;27(4):804-11.
8. Kanavos P, Schurer W, Vogler S. The pharmaceutical distribution chain in the European Union: structure and impact on pharmaceutical prices. 2011.
9. Kanavos P, Manning J, Taylor D, Schurer W, Checchi K. Implementing value-based pricing for pharmaceuticals in the UK. London: 2020health. 2010.
10. Angelis A, Kanavos P. Value-based assessment of new medical technologies: towards a robust methodological framework for the application of multiple criteria decision analysis in the context of health technology assessment. PharmacoEconomics. 2016;34(5):435-46.
11. Espin J, Rovira J. Analysis of differences and commonalities in pricing and reimbursement systems in Europe. Brussels: DG Enterprise and Industry of the European Commission. 2007.
12. Ess SM, Schneeweiss S, Szucs TD. European healthcare policies for controlling drug expenditure. Pharmacoeconomics. 2003;21(2):89-103.
13. Mrazek M, Mossialos E. Regulating pharmaceutical prices in the European Union. Regulating pharmaceuticals in Europe: striving for efficiency, equity and quality Copenhagen, European observatory on health systems and policies. 2004:114-29.
14. Mossialos E, Mrazek M, Walley T. Regulating Pharmaceuticals In Europe: Striving For Efficiency, Equity And Quality: Striving for Efficiency, Equity and Quality: McGraw-Hill Education (UK); 2004.
15. Yfantopoulos P, Yfantopoulos J. The Greek Tragedy in the Health Sector: Social and Health Implications. Vierteljahrshefte zur Wirtschaftsforschung. 2015;84(3):165-82.
16. Europea C. The economic adjustment programme for Greece. European Economy, Occasional Papers, Directorate-General for Economic and Financial Affairs. 2010(61).
17. Economou C. Greece: Health system review. Health systems in transition. 2010;12(7):1.
18. Karakolias SE, Polyzos NM. The newly established unified healthcare fund (EOPYY): current situation and proposed structural changes, towards an upgraded model of primary health care, in Greece. Health. 2014;2014.
19. Vlismas K, Panagiotakos DB, Pitsavos C, Chrysohoou C, Skoumas Y, Sitara M, et al. Quality, but not cost, of diet is associated with 5-year incidence of CVD: The ATTICA study. Public Health Nutrition. 2010;13(11):1890-7.
20. Noorbakhsh F. The human development index: some technical issues and alternative indices. Journal of International Development. 1998;10(5):589-605.
21. Yfantopoulos J. The Greek version of the EuroQol (EQ-5D) instrument. Archives of Hellenic Medicine. 2001;18(2):180-91.
22. Anagnostopoulos F, Yfantopoulos J, Moustaki I, Niakas D. Psychometric and factor analytic evaluation of the 15D health-related quality of life instrument: The case of Greece. Quality of Life Research. 2013;22(8):1973-86.
23. Yfantopoulos JN, Chantzaras AE. Validation and comparison of the psychometric properties of the EQ-5D-3L and EQ-5D-5L instruments in Greece. Eur J Health Econ. 2016.
24. OECD. Health at a Glance: OECD Indicators. OECD Publishing, 2015.
25. Vandoros S, Stargardt T. Reforms in the Greek pharmaceutical market during the financial crisis. Health policy (Amsterdam, Netherlands). 2013;109(1):1-6.
26. Rawlins M, Barnett D, Stevens A. Pharmacoeconomics: NICE's approach to decision‐making. British journal of clinical pharmacology. 2010;70(3):346-9.
27. Devlin N, Sussex J. Incorporating multiple criteria in HTA. Methods and processes London: Office of Health Economics. 2011.
28. Kristensen FB. Development of European HTA: from vision to EUnetHTA. Michael. 2012;9:147-56.
29. Geitona M, Assessing the value of medicinal innovation in an era of increasing austerity. Soc Cohesion Dev. 2012;7(1):39-51.