Visualisation of the results of sequence analysis with the use of Sankey diagrams, based on prevalence analysis of selected medical problems in the years 2013-2015 in Poland.
-
Copyright
© 2017 PRO MEDICINA Foundation, Published by PRO MEDICINA Foundation
User License
The journal provides published content under the terms of the Creative Commons 4.0 Attribution-International Non-Commercial Use (CC BY-NC 4.0) license.
Authors
Introduction. The goal of the study is to assess the usefulness of Sankey model in the analysis of healthcare phenomena. Material and methods. Sequence analysis and Sankey model generation was based on the data provided to the National Health Fund in the years 2013-2015 for the following diseases defined by the following ICD-10 codes: C50.% – malignant neoplasm of breast; G35 – multiple sclerosis; B18.2, B17.1 – chronic hepatitis C. The reported data concerned all types of services provided by the public payer. Results. The analysis was conducted for: C50.% – 3.26 million data records, for 236.6 thousand patients; G35 – 110 thousand data records, for 23.9 thousand patients; B18.2, B17.1 – 1,1 million data records, for 100 thousand patients. Sequence analysis and the generated Sankey diagrams indicate that paths taken by patients in the health care system are varied and are strictly conditional on the medical problem. Conclusion. Sequence analysis, and in particular the diagram-based visualisation of its results enables the assessment of event sequences and their size (number). The analysis of data obtained from actual clinical practice enables obtaining more credible results which may form the correct basis for decision-making.
Introduction
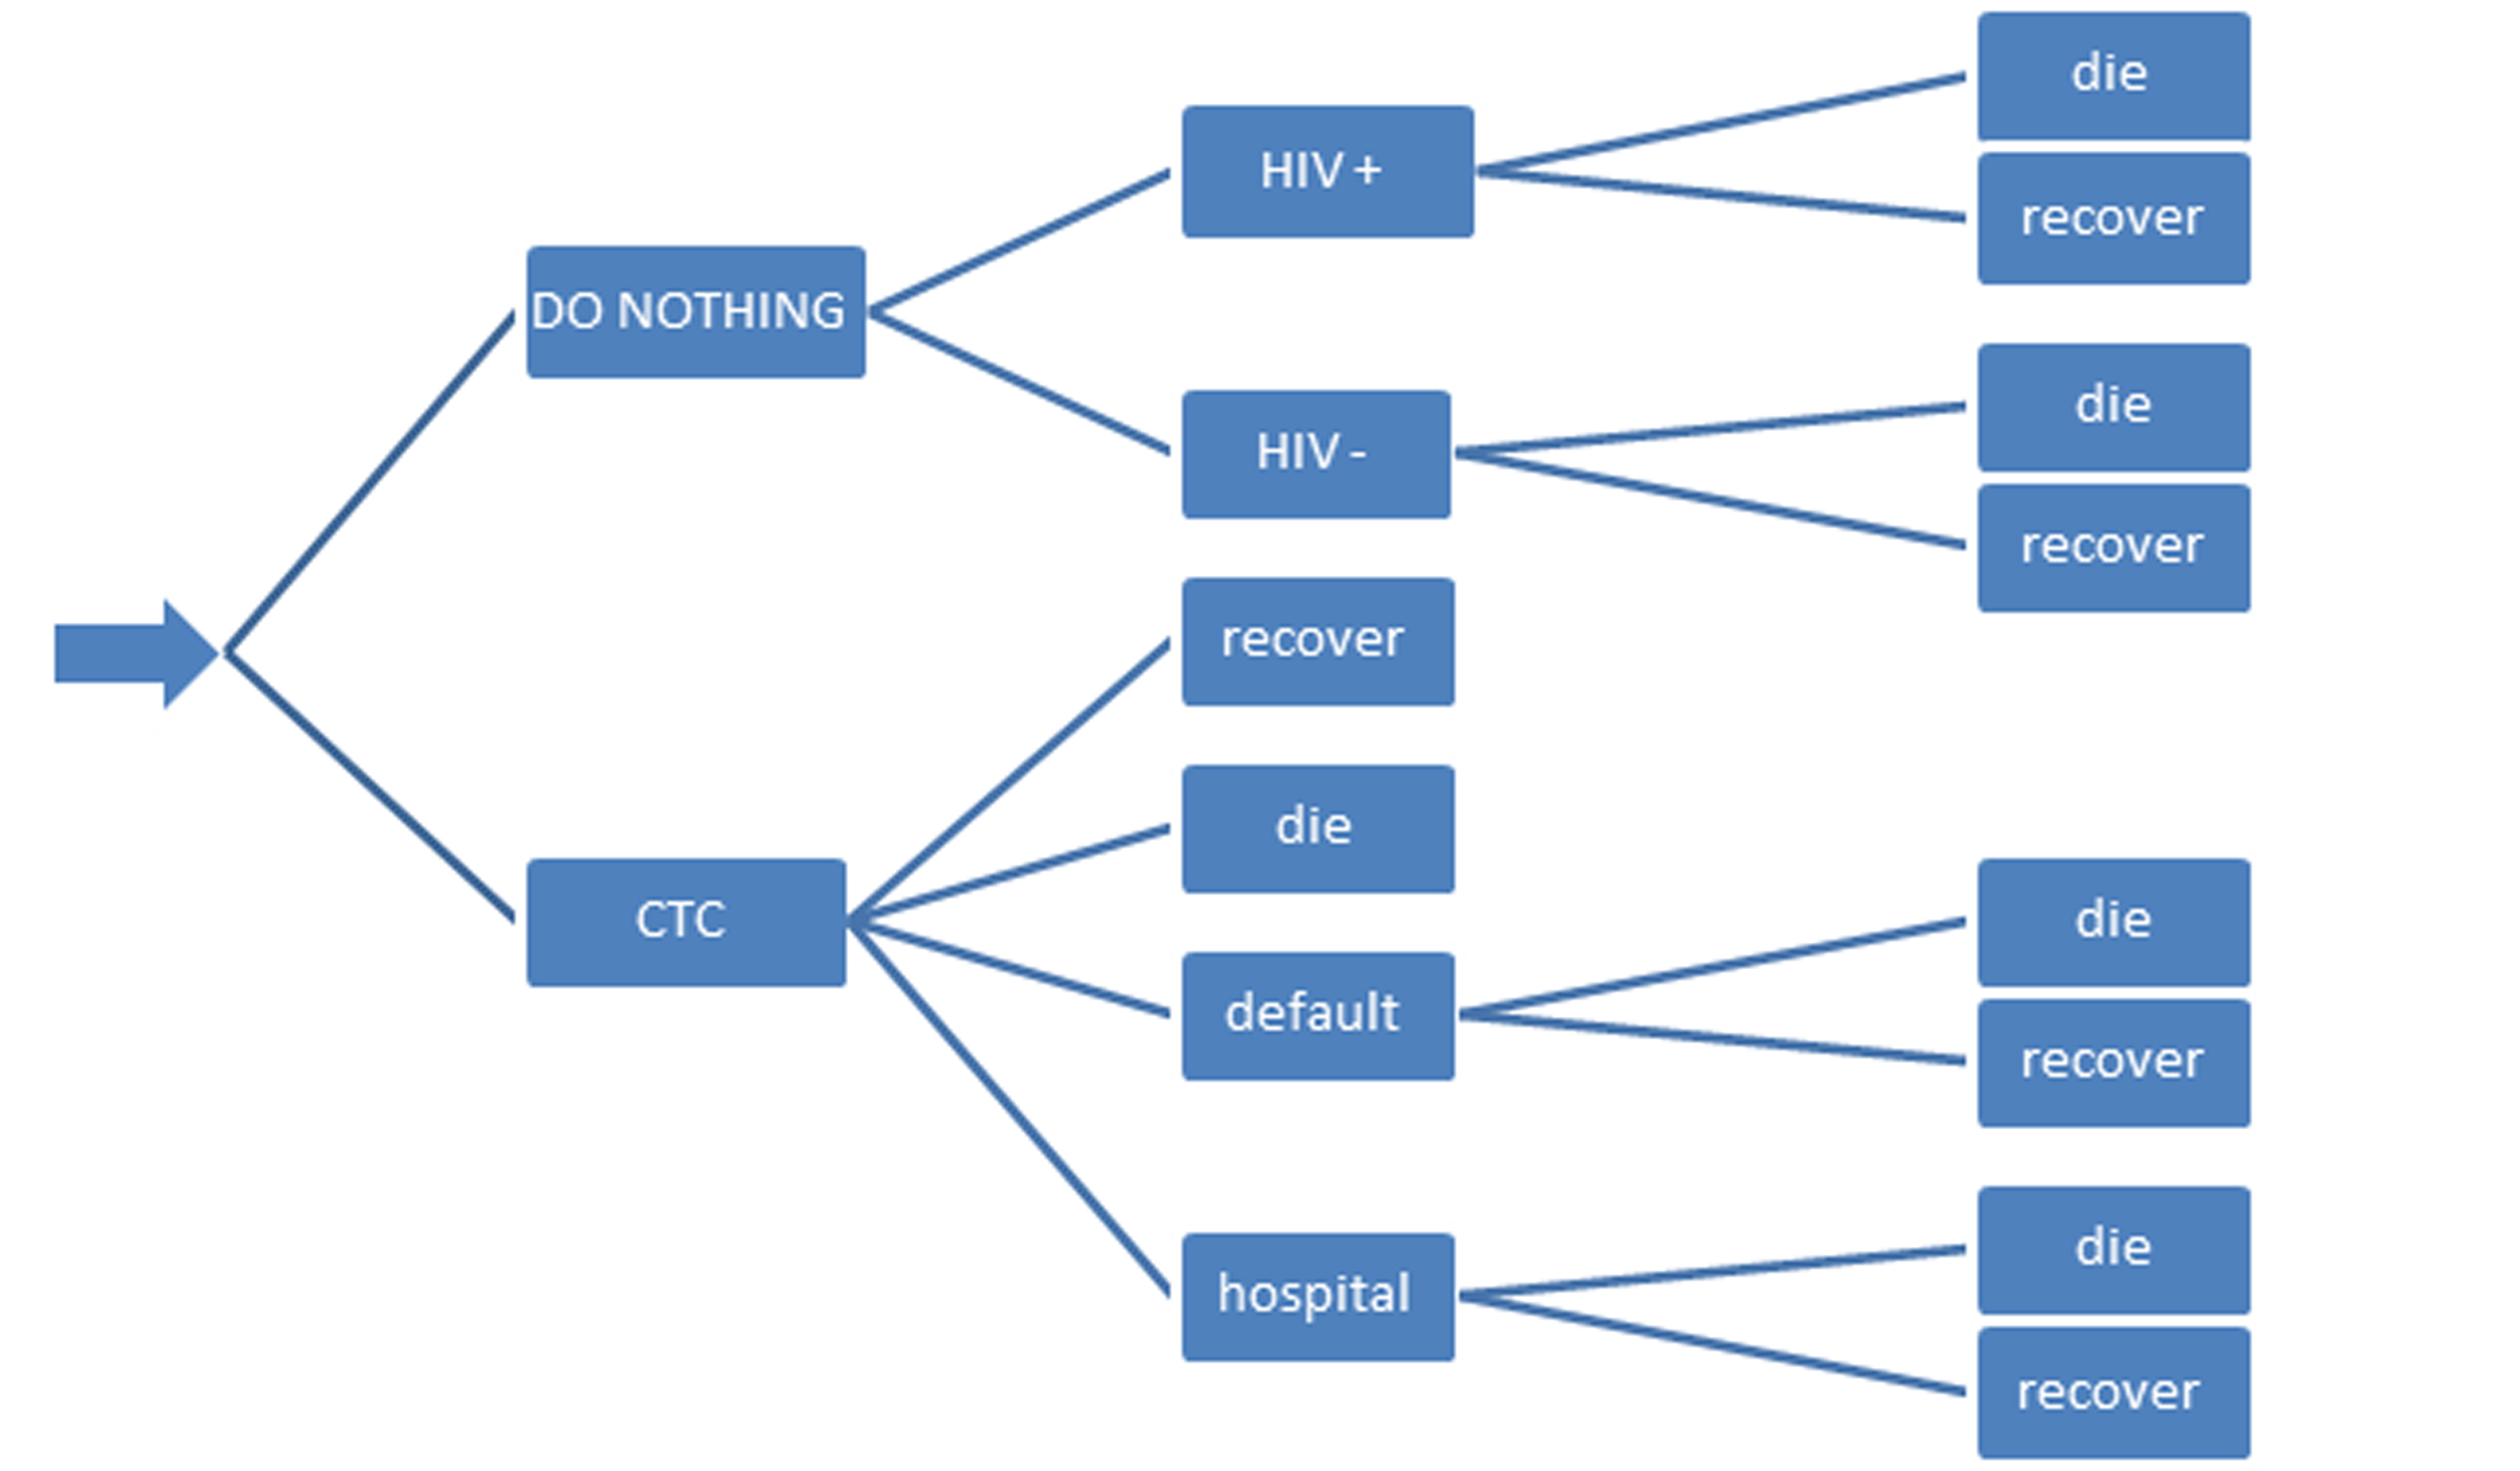
Organisational structures of healthcare in every country force patients onto specific paths, over which they may travel in search of aid. At the same time medical knowledge, and in particular the guidelines of scientific societies or national consultants indicate the most correct sequence and method of providing the patient with individual therapies. In Poland the attending physician (who provides the patient with direct care) is fully able to use the therapy which he considers to be indicated (best) for the patient. Medical event data analysis conducted so far assumed an accounting/balancing approach (the data is reliable and analysed for specific time periods). The possibility of including time as a variable for the classification of the sequence of events is provided by events which enable sequence analysis, which is currently being used more and more frequently, in particular in genetic research [1,2]. Visualisation of the analysis’ results (also when preparing guidelines or recommendations) usually uses decision tree diagrams. Visualisation of the analysis results in this form (decision tree diagrams) encounters at least two problems:
- the created pattern is based on the extrapolation of data resulting from the test sample (with various size) and
- takes into account an assumed (in the guidelines) loss of a number of patients in the process, resulting from the clinical data of the model
(does not include in the model the decision of the patients on continuing or ending contacts with the healthcare system)
The use of a Sankey diagram to present the analysis results enables an intuitive, immediate assessment: in which segment are the largest burdens present, and how the flow of patients with a specific disease is distributed.
Figure 1. An example visualisation of the sequence analysis in the form of a decision tree
Diagrams prepared by Matthew Sankey enable the visualisation of the sequence analysis results in the form of a “data flow” between individual subsequent dates at specific event points. The diagrams were previously used in technical areas for the design of flow systems (water pipelines, power networks) [3,4,5]. A model based on those diagrams assumes the integrity of the observed system and obeying the principles of thermodynamics (conservation of mass and energy). It could be assumed that treating a widely understood healthcare sector as a type of ecosystem, where the processes are subject to the principles of thermodynamics (conservation of mass and energy) enables a sequence analysis, which enables the assessment of the burden on specific sub-segments in relation to a specific disease. In Poland such imaging is made possible by the existence of a single public payer, and thus a standardised set of data.
In order to present the potential of the Sankey diagram based flow analysis three different disease entities were selected, indicated in the “Material and methods” chapter, with differing aetiologies and courses.
The goal of the article is to:
- Indicate the usefulness of the Sankey flow model in health care data analysis;
- Visualise decision paths for most patients with a specific diagnosis;
- Visualise and assess the burden on individual health care sub-segments due to the provision of health services to patients in the context of coordinated care design.
Material and methods
Data of all the patients for whom health care providers reported the following ICD-10 diagnoses (the % character means any number) as the reason for the provision of health care services were selected from the National Health Fund (NFZ) public payer databases:
- C50% – malignant neoplasm of breast
- G35 – multiple sclerosis
- B 18.2; B 17.1 – chronic and acute hepatitis C
in the period from 1 January 2013 to 31 December 2015.
The selected data were not restricted and included all types of services present on the market (Tab 2 – sub-segments of the health care market in Poland). Change of the sub-segment identifier (number) with the event date was indicated as the change of the flow in which the patient is present. The analysis was based on the time course (sequence) of contacts between the patient identifier and the market sub-segment identifier.
As a result of the initial analysis data on the filling of prescriptions in general pharmacies (type: 13. drug price reimbursement) were excluded due to a different system of event financing, and the sequence analysis performed was limited only to the area of health services. Settlement of medical services provided to the patients occurs pursuant to the reports provided to the National Health Fund (national payer) by health care providers [6,7]. Electronic NFZ database concerning medical services provided to the patient covers the entire population and all financed services. Based on the patient identifier (PESEL number), the service type identifier (in accordance with Tab. 2) and the date of provided service, data flow and event sequences were generated and then visualised based on a generated Sankey diagram for each medical problem separately.
The Sankey model is a model based on flow data analysis [8], assuming the existence of a closed environment, in which just as in physical theories there is a transition (transformation) of the observed element between events in a specific sequence (conservation of mass and energy model), ruling out “disappearing” of the information medium (the patient, identified by the PESEL number) from the system. The data concerning the contacts of patients with malignant neoplasm of the nipple in Poland (only in this diagnosis) were used as an example flow of patient data which enables the discussion of the tool used.
The analysis was performed using SAS tools: Enterprise Guide 7.1; Visual Analytics; Data Miner.
Results
Analyses were conducted for: Malignant neoplasms of breast; Multiple sclerosis; Hepatitis C.
Malignant neoplasm of breast
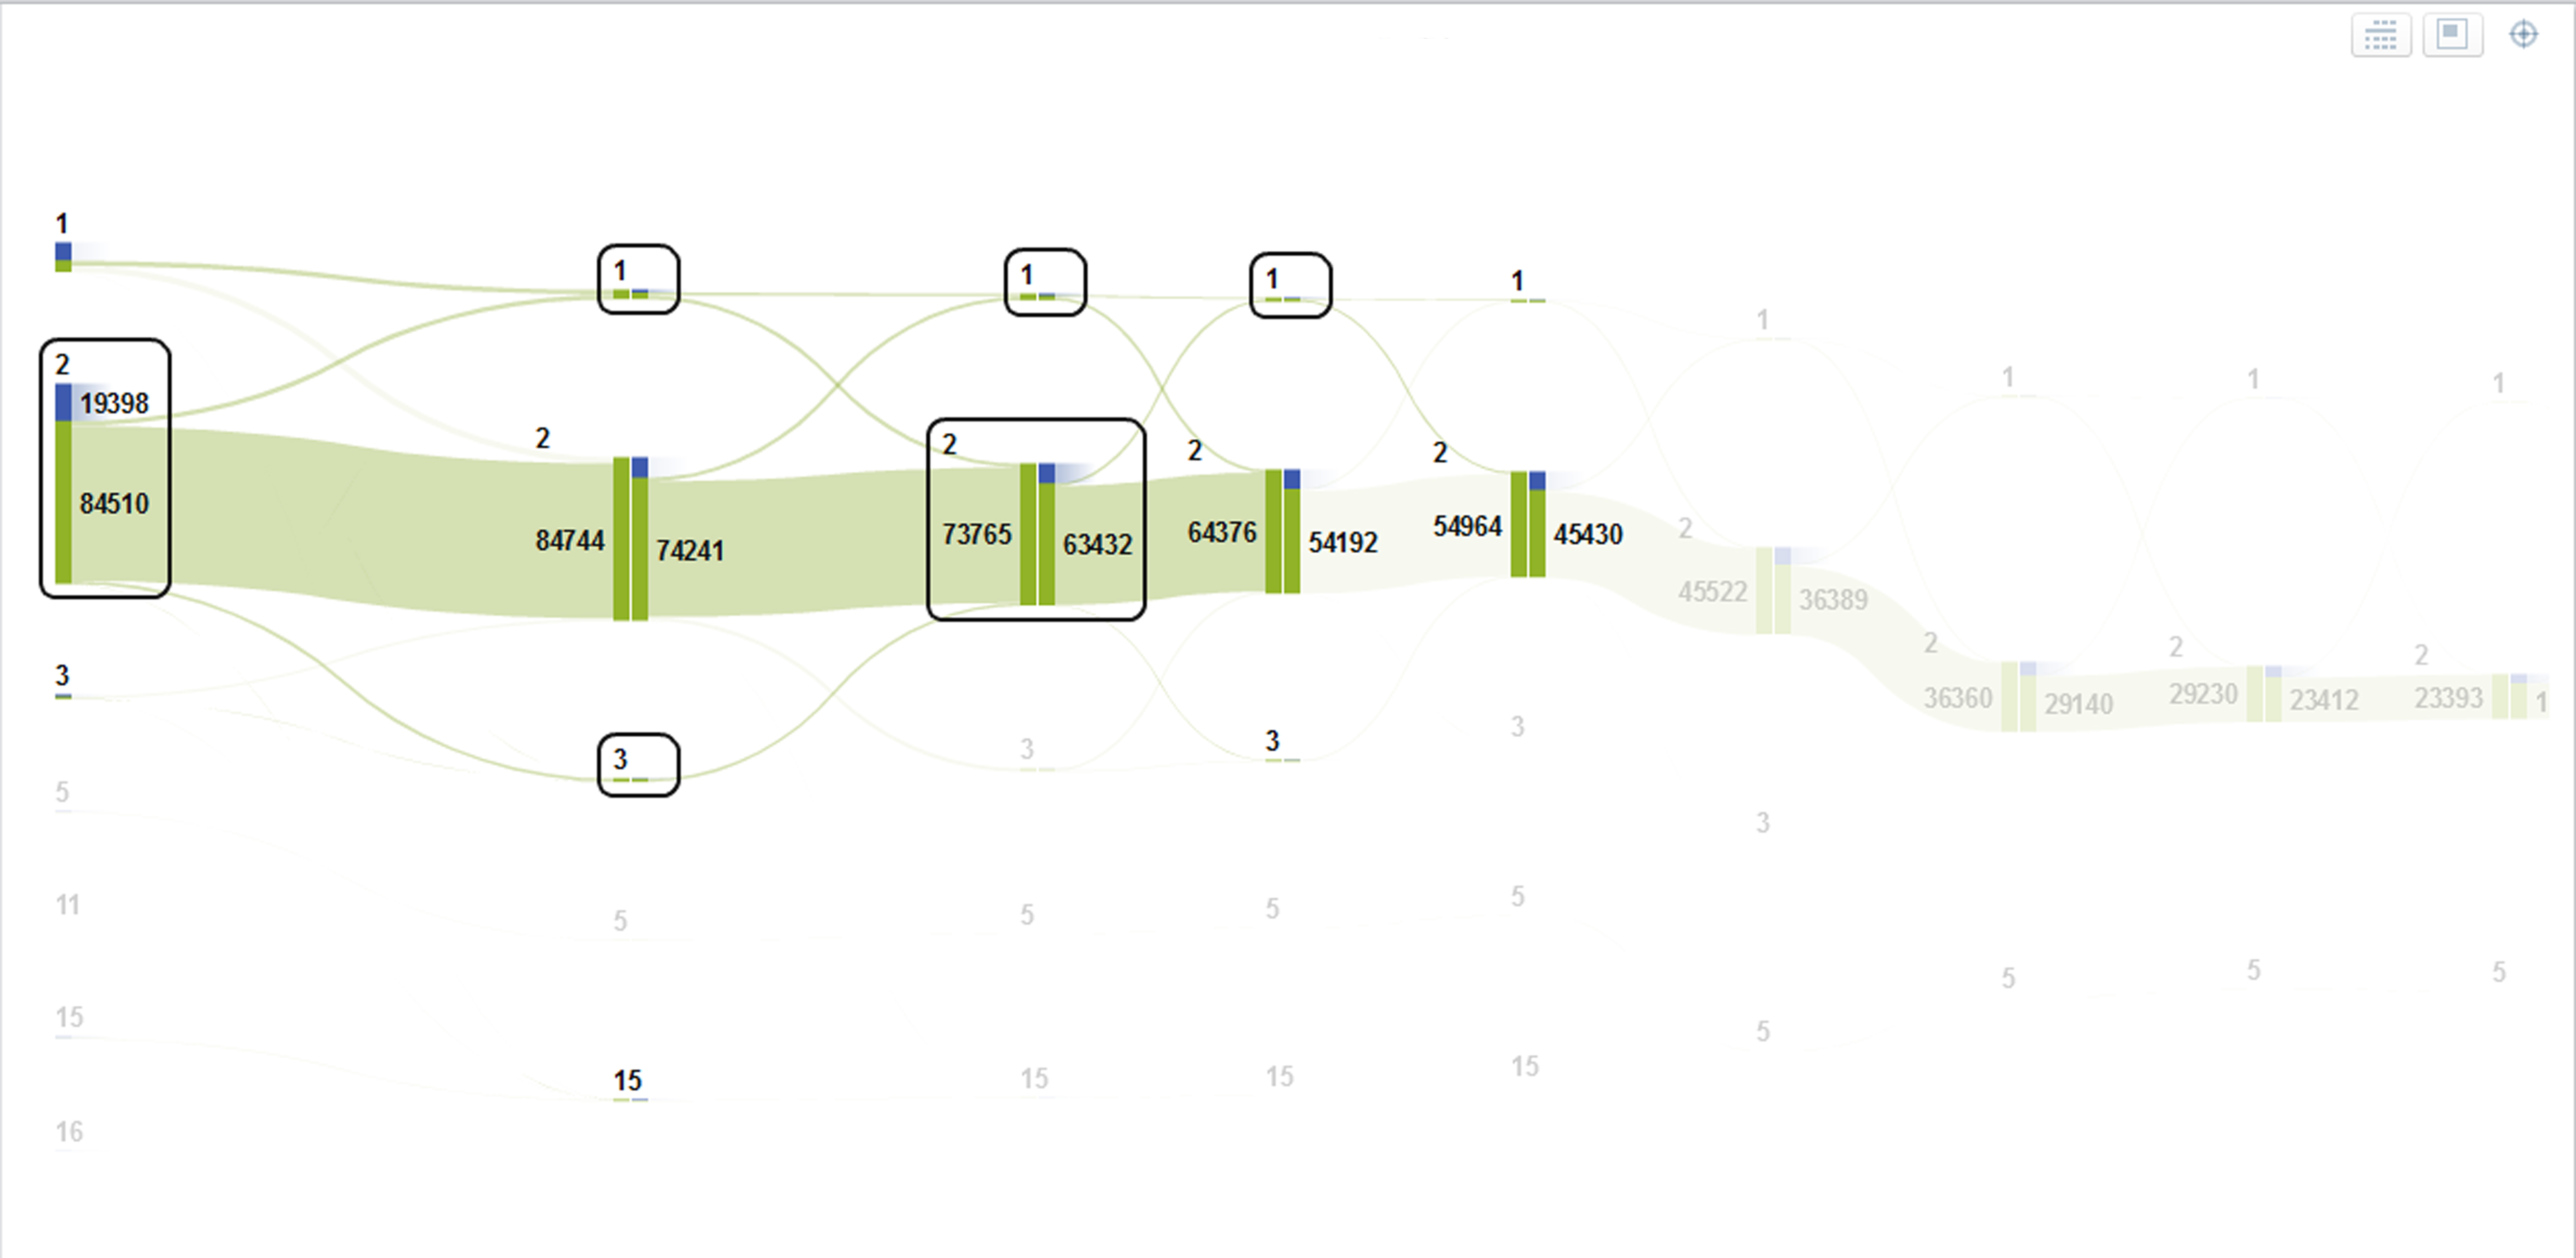
A malignant neoplasm of the nipple is one of the most important health problems worldwide, it may potentially apply to half of the living population, mostly women (cases among men are rare). In the 2013-2015 period in Poland the diagnosis from this group (C50%) was presented to 236,589 patients (approx. 174,000 persons with a clear 5% increasing trend on the average per annum). By selecting from the database the dates of contacts with health care, where the doctors have presented the patients with C50% as the main diagnosis in combination with patient ID and service type number (health care sub-segment) a database was obtained (with a total of 3.26 million records), used to generate the sequence of contacts of the patient with individual types of health services, which were then presented in the form of a Sankey diagram (Fig 2).
Figure 2. Flow analysis model for patients with breast neoplasm (C50%) in the 2013-2015 period
The sequence analysis conducted and the Sankey diagram (Fig 2) presenting its results for C50% includes 87,826 paths of contact between the patient with individual types of services, applies to service types with numerical ID (sub-segments): 1; 2; 3; 5; 11; 15; 16 (acc. to Table 1). The patient path including the most numerous changes of the type of services made by the patient amounts to 1092 sequences. The presented Sankey diagram concerns over 85% of data, those with a length below 936 changes, and on Figure 1 for technical reasons the 300 most frequent were presented (concerning 85% of patients). Sequences of events with the same variability (the same flow changes) applied to 28 to 82,348 persons. Only for 2 paths containing simultaneous events an artificial succession order was generated.
The number of patients taking into account the sub-segment where the first contact has occurred is presented in Table 1.
Table 1. The number of patients, for whom first contact occurred for the specific type of services
|
Type of services |
Number of patients (do not add due to the presence of the same PESEL no. in more than 1 segment) |
Share |
|
01 PRIMARY HEALTH CARE |
100,928 |
22% |
|
02 AMBULATORY SPECIALIST CARE |
218,276 |
48% |
|
03 HOSPITAL TREATMENT |
74,500 |
16% |
|
04 PSYCHIATRIC CARE AND DEPENDENCY TREATMENT |
1 |
0% |
|
05 MEDICAL REHABILITATION |
35,856 |
8% |
|
07 DENTAL TREATMENT |
4 |
0% |
|
11 SEPARATELY CONTRACTED SERVICES |
9,389 |
2% |
|
14 CARE AND NURSING SERVICES |
244 |
0% |
|
15 PALLIATIVE AND HOSPICE CARE |
14,733 |
3% |
|
16 EMERGENCY MEDICAL SERVICES |
3,587 |
1% |
The main sub-segment of healthcare is Ambulatory Specialist Care (02), where the main flow of patients occurs (48% of patients). Moreover in the studied period the patients have also presented themselves for the first time: Primary health care (01) – 22%; Hospital treatment (03) – 16%; Medical rehabilitation (05) – 8%; Palliative and long-term care (15) – 3%.
On Figure 1 the 300 most numerous patient contact paths were presented with individual types of services (under the indicated diagnosis of malignant neoplasm of the nipple) with the highlighted flow starting at Ambulatory Specialist Care (02). Within this data flow 103,908 patients were observed (47.6% of all paths) having their beginning in ASC (for 19,398 patients), of which 18.66% of the paths ended with first contact (dark blue line, not connecting to subsequent types of services), and in 81.33% (for 84,510 patients) another contact has occurred as part of another type of services (health care sub-segment). Of these persons indicated further on in the second step/contact for 2802 patients (approx. 1.3%) contact has occurred under Primary Health Care and for 1827 persons (approx. 0.85%) under Hospital Treatment. For the second decision node under ASC contact was made by 87,252 persons (approx. 40% of persons) of which for 10,503 persons (approx. 12%) stopped being listed with the aforementioned diagnosis, and 76,749 (approx. 88%) were listed further.
Multiple sclerosis
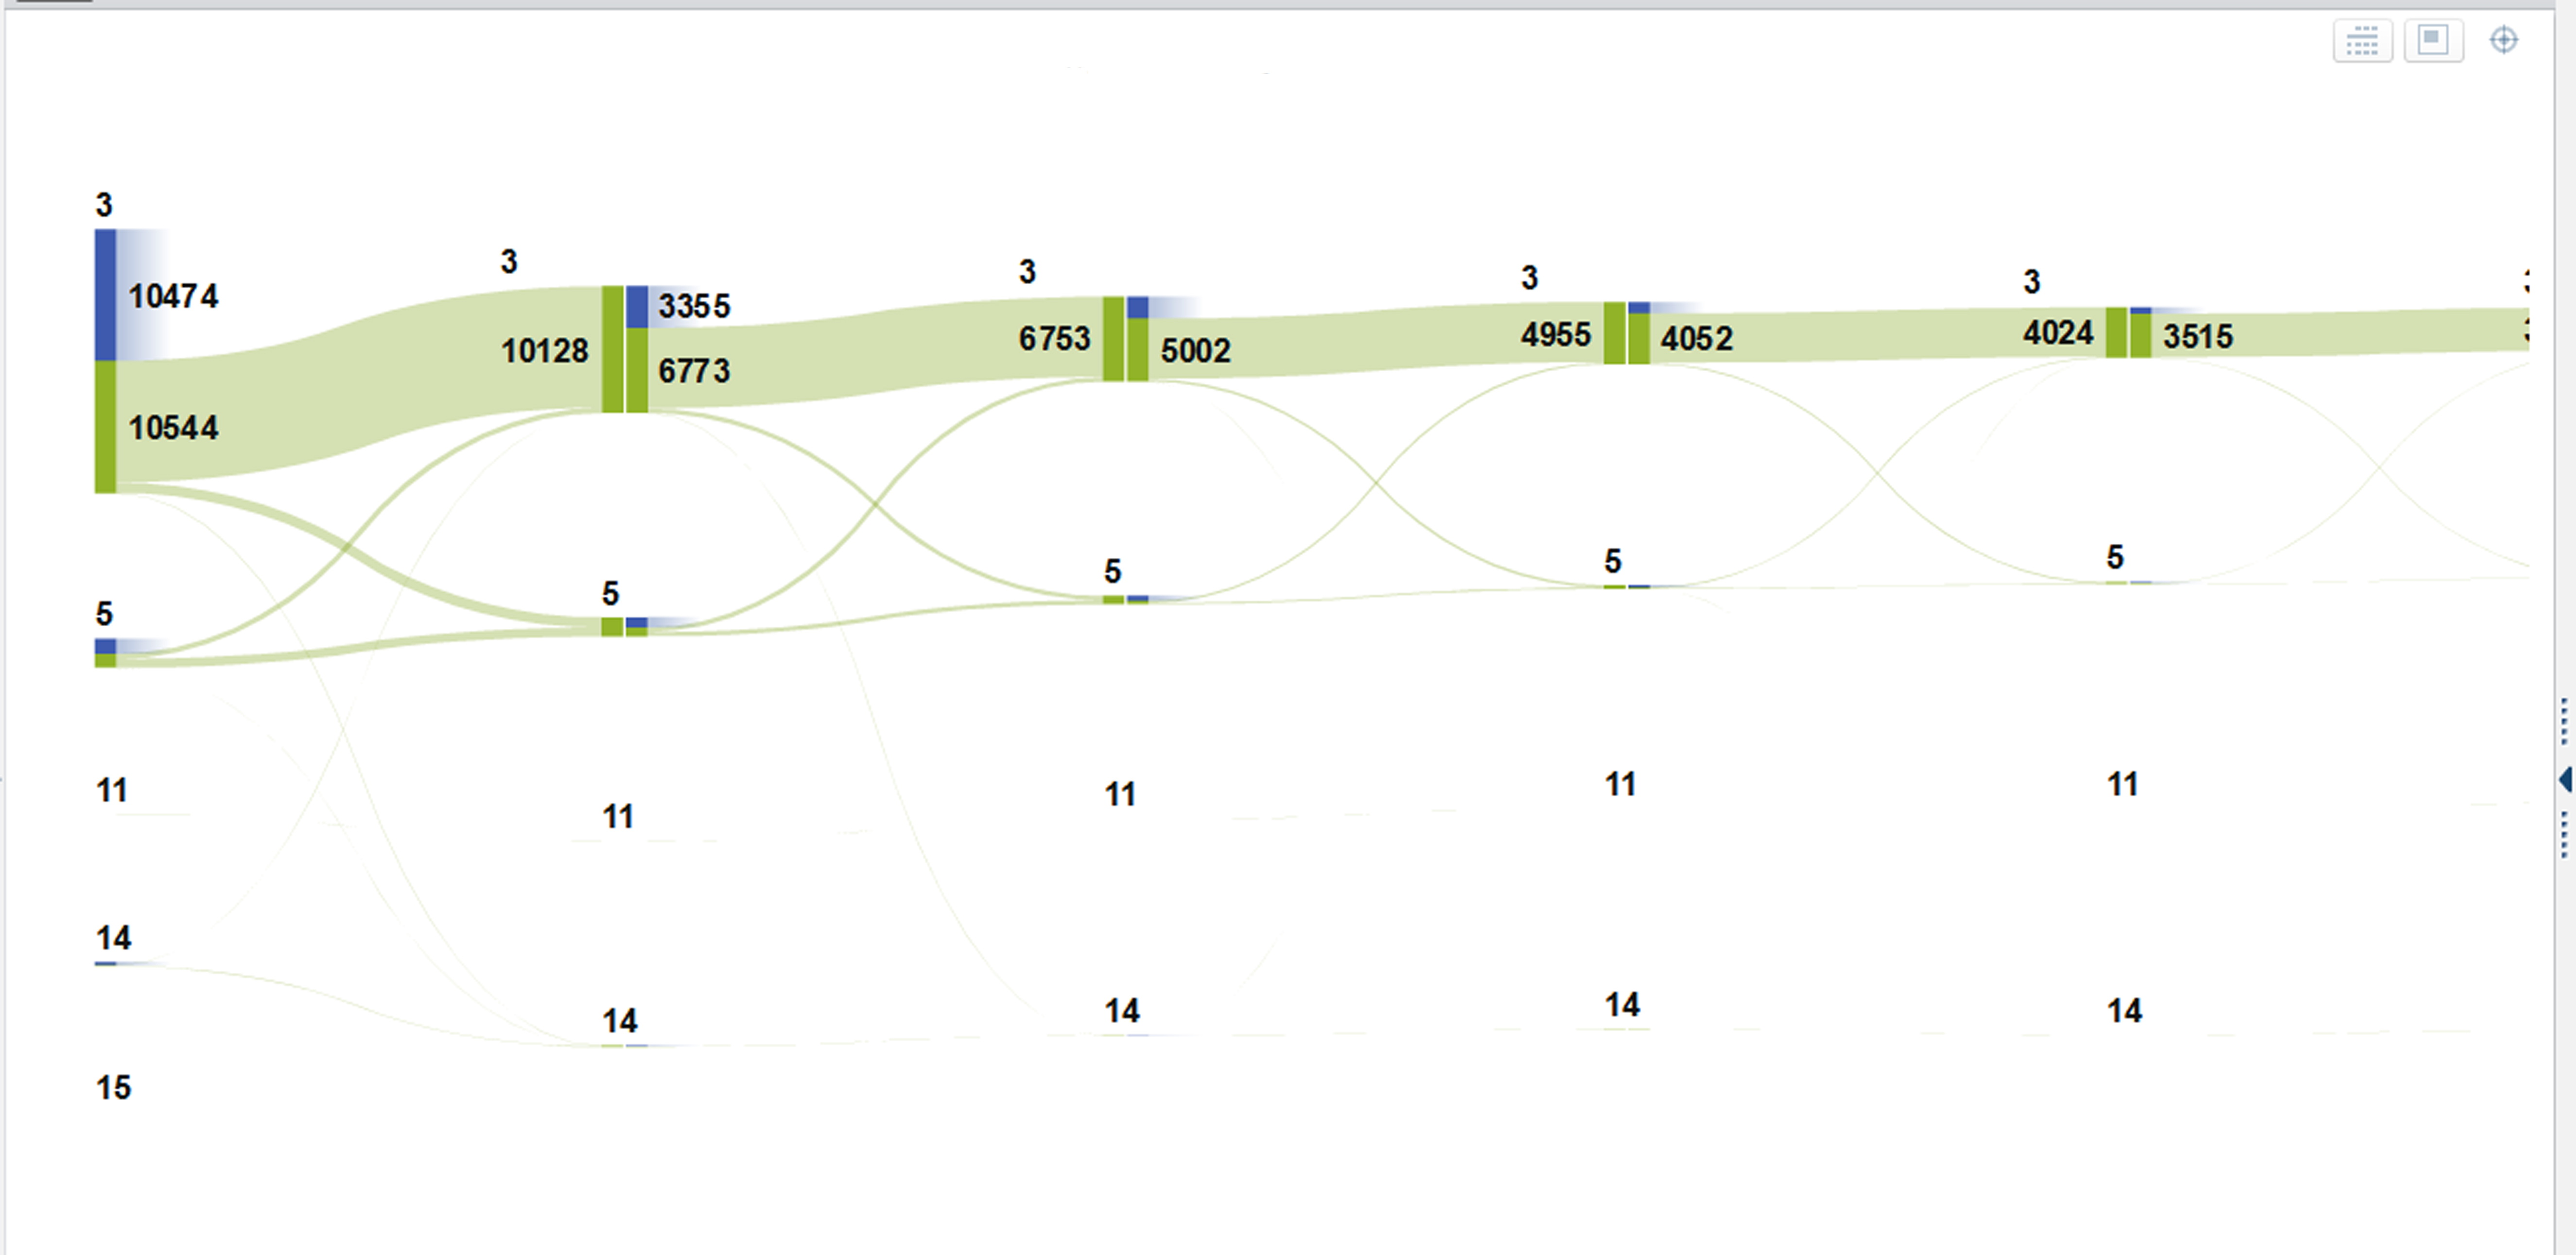
The diagram (Fig 3) presents a flow model for another medical problem – multiple sclerosis. In this diagnosis the following healthcare sub-segments are not present at all: Primary Health Care (01) and Ambulatory Specialist Care (02). In the 2013-2015 period in Poland the diagnosis of sclerosis multiplex (G35) was presented to 23,984 persons (acc. to unique patient identifiers), for whom 110,396 contacts were observed (the average number of patients annually was approx. 12.7 thousand persons), for this disease the annual number of patients in Poland is relatively constant (an increasing trend of approx. 0.8%). By selecting from the database dates of contact with health care, where doctors have presented the patient with G35 as the main diagnosis in combination with patient ID and the healthcare market sub-segment number a database was obtained, used to generate a Sankey diagram (Fig 3), with a total of 110 thousand records.
In the first decision step (first, minimum date present for the patient) the data flow (Fig 3) was presented for 26,132 patient-events. The distribution of the number of patients between individual types of services is presented by the table below:
Table 2. The number of patients, for whom first contact occurred for the specific type of services
|
Type of services |
Number of patients |
Percentage share |
|
03 HOSPITAL TREATMENT |
21,830 |
83.54% |
|
05 MEDICAL REHABILITATION |
3,842 |
14.70% |
|
11 SEPARATELY CONTRACTED SERVICES |
19 |
0.07% |
|
14 CARE AND NURSING SERVICES |
438 |
1.68% |
|
15 PALLIATIVE AND HOSPICE CARE |
3 |
0.01% |
For this disease the main sub-segment of health care of first contact is Hospital Treatment (03), where the main flow of patients is present (83.5% of all patients). The remaining patients (16.5%) have presented themselves for the first time (in the studied period): Medical rehabilitation (05) – 14.7%; Care and Nursing Services (14) – 1.7%; Separately Contracted Services (11) – 0.07%; Palliative and Hospice Care (15) – 0.01%.
Figure 3. Flow analysis model for patients with multiple sclerosis (G35) in the 2013-2015 period
On the Figure 3 the 300 most numerous patient-healthcare contact paths were presented under the indicated diagnosis of multiple sclerosis) with the highlighted flow starting at Hospital Treatment (03). Within this data flow 21,054 patients were observed (87.7% of all paths) having their beginning in HT (03), of which 49.7% of the paths (10,474 patient-events) ended with first contact (dark blue line, not connecting to subsequent types of services), and in 48.29% (10,166 patients) another contact has occurred as part of another type of services (health care sub-segment). Of these persons which were present further on for 848 patients (approx. 4%) another contact occurred as part of Medical Rehabilitation. For the second decision node under HT (03) contact was made by 10,166 persons, at this moment for 3355 persons (approx. 33%) their indication with the aforementioned diagnosis stopped, and 6811 (approx. 67%) were further indicated under HT (03), and 363 persons (3.57%) have made use of (transferred to) the Medical Rehabilitation (05) sub-segment.
Hepatitis C
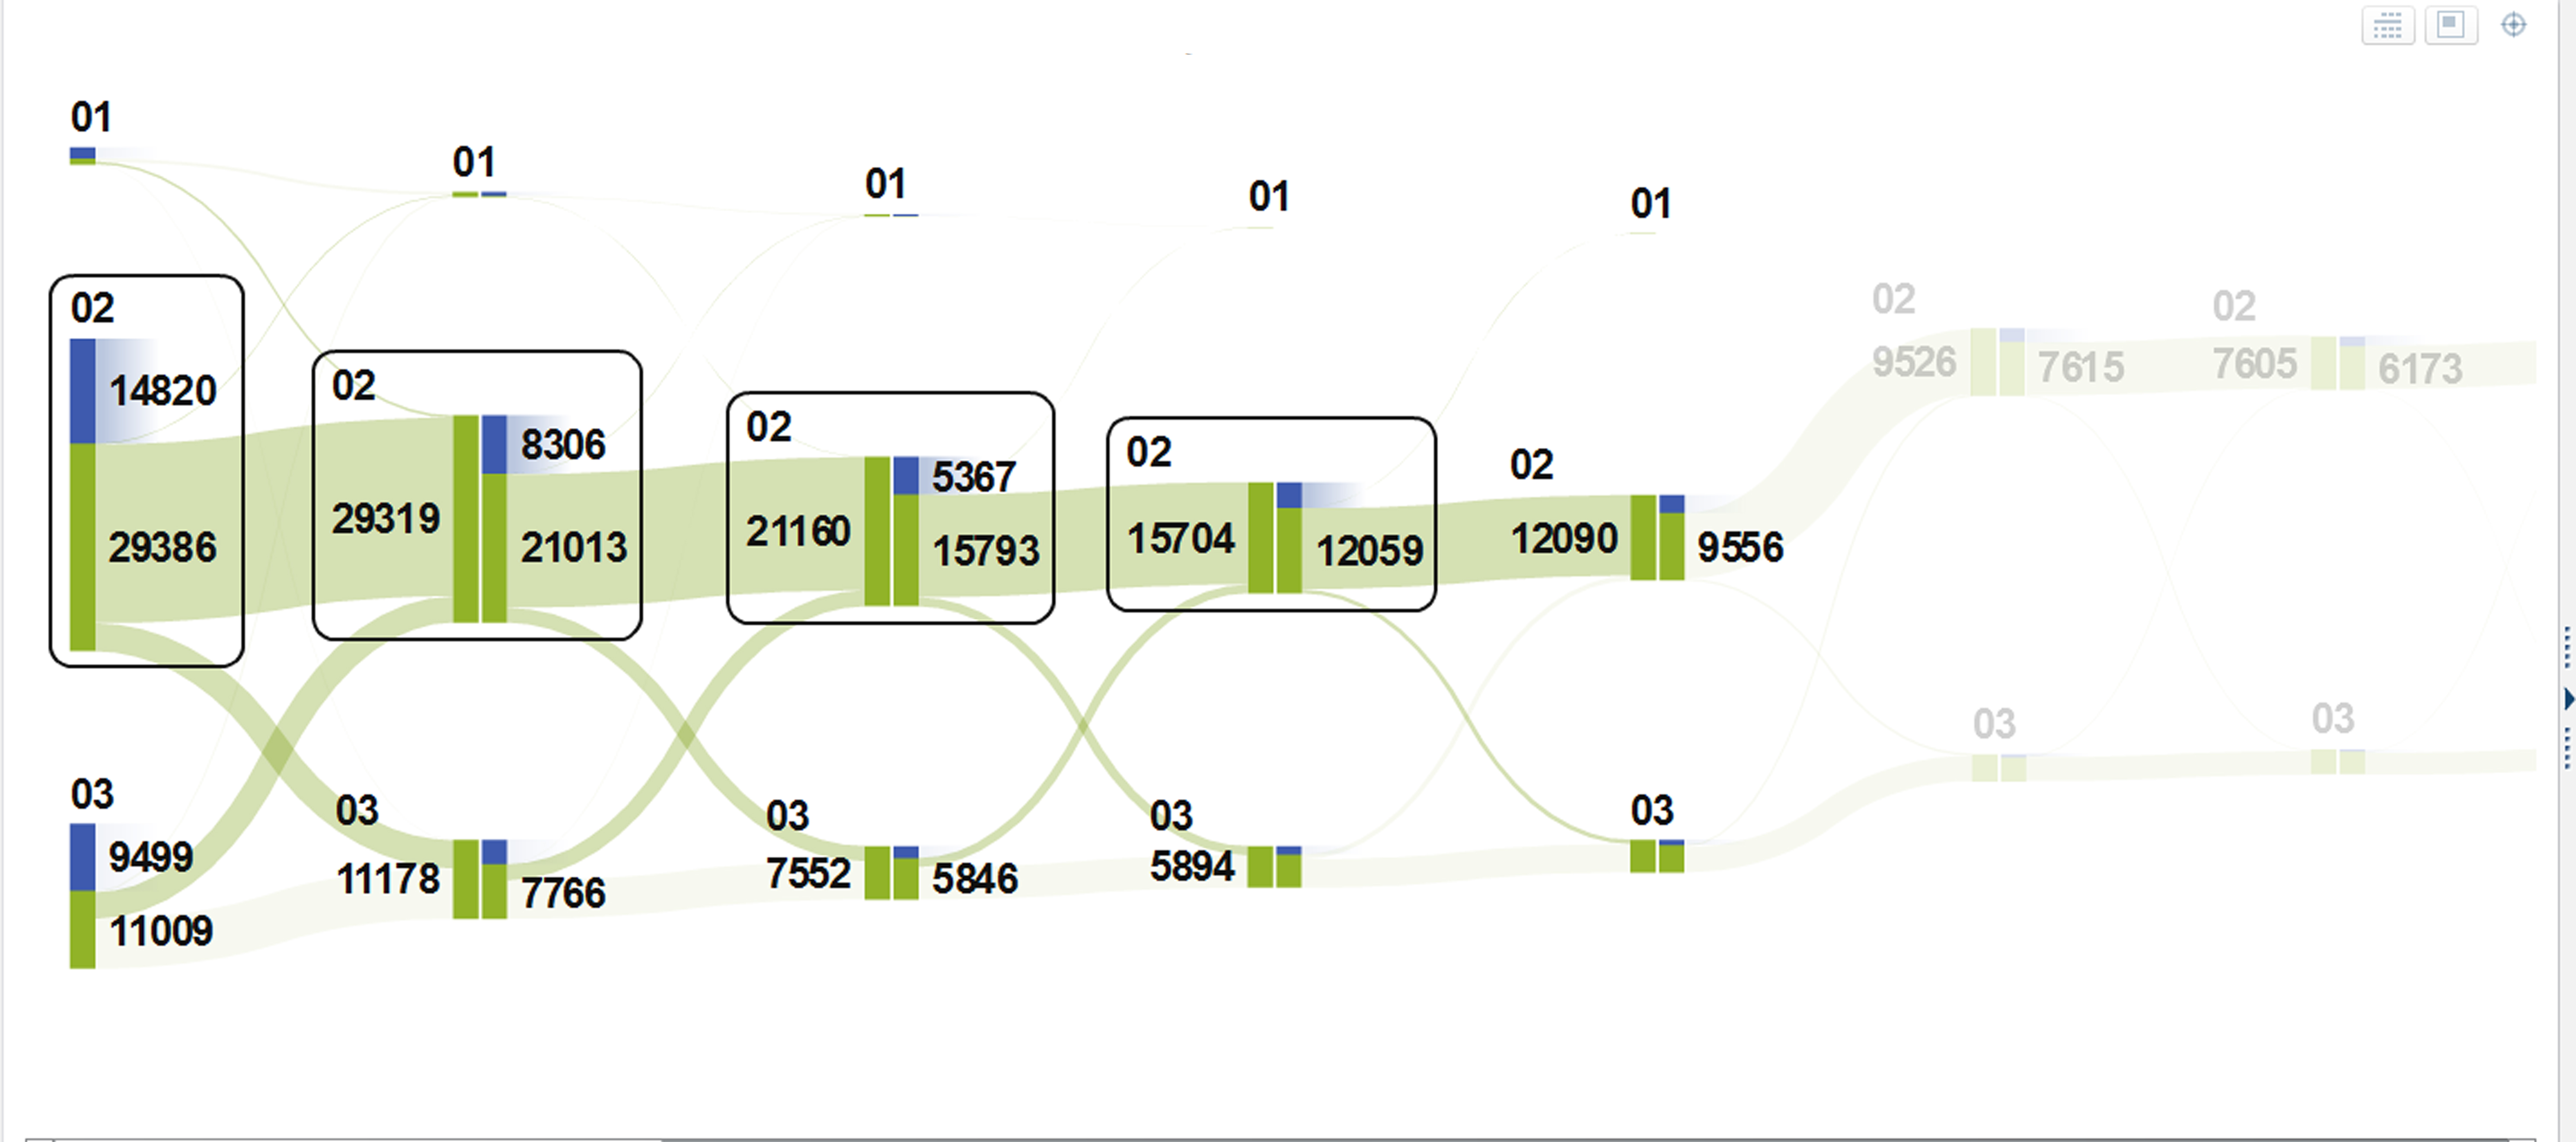
The diagram (Figure 4) presents the flow model for another medical problem – hepatitis C. In this diagnosis the main health care sub-segment is Ambulatory Specialist Care (02) and another important area is Hospital Treatment (03). The Primary Health Care (01) segment occurs rarely. In the 2013-2015 period in Poland the diagnosis of hepatitis C (B17.1 or B18.2) was presented to 100,024 patients, for whom 1,048,317 contacts were observed (the average number of patients annually was approx. 34.4 thousand persons), for this disease the annual number of patients in Poland is relatively constant (an periodical increasing trend of approx. 3.3%). By downloading from the database dates of contact with health care, where doctors (or other medical professionals) have presented the patient with B17.1 or B18.2 as the main diagnosis in combination with patient ID and the healthcare market sub-segment number a database was obtained, used to generate a Sankey diagram (Figure 3), with a total of 1,048 thousand records.
In the first decision step the data flow (Figure 3) was presented for 151.213 patient-events. The distribution of the number of patients between individual types of services is presented by the table 3 below.
Table 3. The number of patients, for whom first contact occurred for the specific type of services
|
Type of services |
Number of patients |
Share |
|
01 PRIMARY HEALTH CARE |
9,652 |
6.4% |
|
02 AMBULATORY SPECIALIST CARE |
81,513 |
53.9% |
|
03 HOSPITAL TREATMENT |
60,001 |
39.7% |
|
05 MEDICAL REHABILITATION |
4 |
0.0% |
|
06 LONG TERM CARE |
1 |
0.0% |
|
09 IMMEDIATE CARE AND AMBULANCE TRANSPORT |
1 |
0.0% |
|
11 SEPARATELY CONTRACTED SERVICES |
10 |
0.0% |
|
14 CARE AND NURSING SERVICES |
7 |
0.0% |
|
16 EMERGENCY MEDICAL SERVICES |
24 |
0.0% |
In case of Hepatitis C first contact usually occurs in Ambulatory Specialist Care (02) where the main stream of patients occurs (53.9% of patients). The remaining patients have presented themselves for the first time (in the studied period) also in: Primary Health Care (01) – 6.4%; Hospital Treatment (03) – 39.7%; Single cases have presented in the following types of services: Medical rehabilitation (05); Long term care (06); Immediate care and ambulance transport (09); Separately contracted services (11);Care and Nursing Services (14); Emergency Medical Services (16).
Figure 4. Health distributions in Hepatitis C in the years 2010-2015
On Figure 4 200 patient health care contact paths were presented for the highest number of patients with indicated main diagnosis of viral hepatitis, with highlighted main flow starting at Ambulatory Specialist Care (02). Within this data flow 55,384 patient contact paths were observed (36.6% of all paths) having their beginning in ASC (02), of which 26.7% of the paths (for 14,820 patient-events) ended with first contact (dark blue line, not connecting to subsequent types of services), and in 53.2% (29,386 patient-events) another contact has occurred as part of another type of services (health care sub-segment) and 20.1% ended in Hospital Treatment (03). In the second contact 28% of the paths ended at ASC (02), 64% continued therapy in ASC, and 7% moved to Hospital Treatment (03).
Discussion
The need to establish as precisely as possible the order of medical treatment in a patient suffering from a specific disease is necessary to design and publish medical guidelines for doctors. The medical data analyses conducted for this purpose so far were based on observations of patient samples and medical actions in individual health care facilities. To visualise the results from study cohorts obtained in this manner decision tree diagrams (Fig 1) were used most frequently, and Sankey diagrams were not used. The analysis presented in the “results” section applies to entire population of Poland with the specific disease. The dates of contact between the patient and doctors and medical professionals were indicated (reported) by healthcare providers as the date on which the patient received help, these are actual, complete dates of provision of medical services related to the disease in question. Using this data set it was possible to analyse a sequence of actual data, the results of which were presented on Sankey diagrams for the medical cases under discussion. A limitation on the analysis is the lack of data on the events financed privately, out of pocket by the patients themselves (there is no such database in Poland), however it may be guessed that these expenses of Polish households include mainly simple and cheaper forms of health care and those which are fully paid by their nature (e.g. dietary supplements), and the tendency to self-finance health care decreases with the severity and expense of the therapy (which is the case for the selected health cases).
The analysis demonstrated significant differences between disease entities, in particular concerning the first place of diagnosis, from which the patient moves between various types of healthcare services. Patients suffering from the malignant neoplasm of the breast C50% are usually diagnosed first under Ambulatory Specialist Care (85% of the patients), due to the screening program (mammography) performed in this segment, which demonstrates that this analysis result is correct. The diagram also presents this segment as the most numerous (Fig. 2) in a correct manner. The case of multiple sclerosis is different, where almost all first contacts (83.5%) are observed as part of Hospital Treatment. This results first from the special conditions required to issue the diagnosis (among others having a magnetic resonance imager). The second reason for the occurrence of G35 patients solely in hospital treatment is the specific development of the disease, which manifests in periods of remission and occurring relapses, and the fact that therapy is possible only through this type of services. The third example of an infectious disease, viral hepatitis C, in this example the sequence of events indicates that the first diagnosis is made under two types of services: Ambulatory Specialist Care (36.6%) and Hospital Treatment (20.1%). The diagnosis of Hepatitis C is possible in medical providers who have doctors specialising in infectious diseases in their resources, and such a resource is available only in those two segments of the market. The results of the analysis have confirmed the recommended patient therapy paths. The additional result of the analysis is the assessment and presentation in the visualisation of the share of events which end at a given segment (darker, interrupted line). This result and its visualisation is very important, due to the lack of previous analyses and the assessment of “over-diagnosing” of the given disease and the burden placed on the segment by the services related to the phenomenon.
Conclusions
- Sequence analysis, and in particular the visualisation of its results based on the diagrams enables the assessment of event sequences and their size (number).
- The Sankey diagrams enable the assessment of the burden placed on the healthcare market segment related to the disease in question.
- The Sankey diagrams enable the assessment of the share of one-time events among the general number of events.
- The analysis and visualisation of the sequence enable the assessment of current therapy guidelines, preparation of new and subsequent guidelines, and correcting them based on the actual time component.
- The analysis of data obtained from actual clinical practice enables obtaining more credible results which may form the correct basis for the decisions that were made.
References
- Gürtler LG, Eberle J. Aspects on the history of transmission and favor of distribution of viruses by iatrogenic action: perhaps an example of a paradigm of the worldwide spread of HIV. Med Microbiol Immunol. 2017 Apr 22. doi: 10.1007/s00430-017-0505-2.
- Seo JK, Kwak HR, Kim MK, Kim JS, Choi HS. The complete genome sequence of a novel virus, bellflower veinal mottle virus, suggests the existence of a new genus within the family Potyviridae, Arch Virol. 2017 Apr 22. doi: 10.1007/s00705-017-3374-5.
- Schmidt M. The Sankey Diagram in Energy and Material Flow Management. Journal of Industrial Ecology. 2008; 12(1): 82-94.
- Riehman P, Hanfler M, Froehlich B. Interactive Sankey diagrams. Information Visualization. INFOVIS, IEEE Symposium, 2005.
- Khurana S, Banerjee R. Energy balance and cogeneration for a cement plant. Applied Thermal Engineering. 2002; 22(5): 485-494.
- 27 August 2004 Act on health care services financed from public funds (Dz. U. of 2015, item 581) [Polish].
- 20 June 2008 Regulation of the Minister of Health on the scope of necessary information collected by service providers, detailed method of recording such information and its provision to entities required to finance the services from public funds (Dz.U. of 2016, 192 as amended) [Polish].
- 8. Rollat A, Guyonnet D, Planchon M, Tuduri J. Prospective analysis of the flows of certain rare earths in Europe at the 2020 horizon. Waste Manag. 2016; 49: 427-36.


